jgroup
As most know, legendary investor Benjamin Graham famously authored The Intelligent Investor, in which he describes the “Margin of Safety” as the single-most important concept that’s central to the investing process. In his book, Graham explains,
The function of the margin of safety is, in essence, that of rendering unnecessary an accurate estimate of the future. If the margin is a large one, then it is enough to assume that future earnings will not fall far below those of the past in order for an investor to feel sufficiently protected against the vicissitudes of time.
Simply put, the “Margin of Safety” is the buffer in price that increases your chances of profits but does not guarantee a loss. Graham explains that “the investor’s concept of the margin of safety rests upon simple and definite arithmetical reasoning from statistical data.”
To have a true investment, there must be present a true margin of safety. And a true margin of safety is one that can be demonstrated by figures, by persuasive reasoning, and by reference to a body of actual experience.
Remember that REITs are different from ordinary stocks (C-Corps and the like) in that this unique real estate asset class requires a different kind of calculation. As I explain in one of my books,
“Remember that real estate depreciation is always treated as an expense in accounting. Yet real estate appreciates in value as long as it’s in a good location and well-managed, generally rising due to:
* Inflation and increasing construction costs
* Rising rents and operating income
* Property upgrades
* The finite nature of available land.”
So, when valuing REITs, you must always use Price to Funds from Operations (P/FFO) and not Price to Earnings (P/E).
Over my 14 years on Seeking Alpha, I have found this to be one of the most misunderstood valuation metrics and extremely critical when determining whether there’s an adequate “Margin of Safety”.
REITs for Dummies by Brad Thomas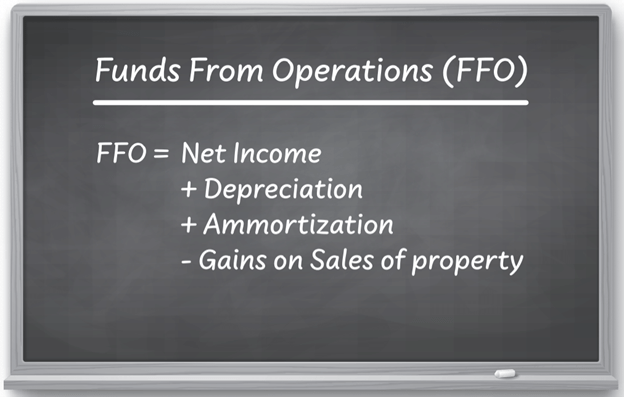
Cousins Properties (CUZ)
CUZ is a real estate investment trust (“REIT”) that specializes in the development, acquisition, and management of premier office properties in the United States.
The company invests in Class A office properties within the Sunbelt region of the country and has a particular focus on Atlanta, Tampa, Austin, Charlotte, Dallas, Nashville, and Phoenix.
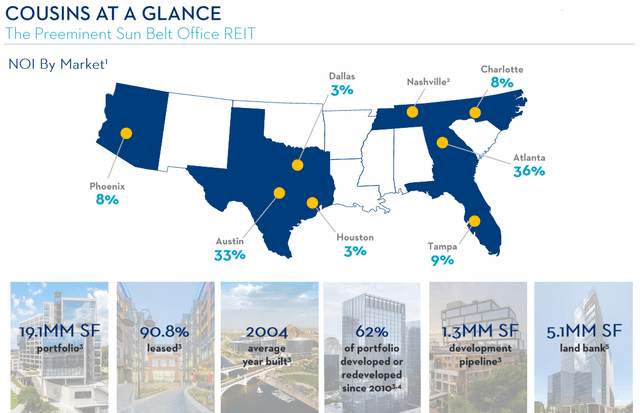
Cousins has a market cap of approximately $4.2 billion and a 19.1 million SF portfolio that is 90.8% leased, 100% Sunbelt, and consists entirely of Class A buildings. Roughly 62% of its portfolio has been delivered or redeveloped since 2010 and the portfolio as a whole has a 2004 average build date.
There are several strong trends in the office sector that benefit the company.
Not only do you have ongoing Sunbelt migration that has led to higher than average job and population growth, but post-pandemic there has been a flight to quality in the office sector. Businesses and workers are demanding more from the office, primarily newer builds with more amenities.
CUZ’s portfolio is well positioned to take advantage of the current office trends, as its entire portfolio consists of Class A properties located in the Sunbelt.
In addition to its operating properties, the company has a development pipeline totaling 1.3 million SF and a land bank that is able to support another 5.1 million SF of development.
The company’s largest market is Atlanta, which makes up 36% of its net operating income (“NOI”), followed by Austin and Tampa that make up 33% and 9%, respectively.
CUZ compares well against its office peers when looking at lease expirations over the next several years. 18.4% of its current leased space is set to expire between 2024 and 2026. This compares with the office sector average of 27.3%.
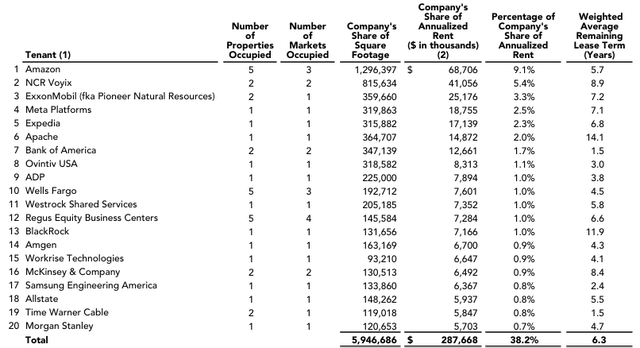
The company’s modest near-term lease expirations position it well for organic growth and earnings stability. Additionally, the company has a high-quality list of tenants that includes names like Amazon, Exxon Mobil, Meta Platforms, Bank of America, BlackRock, and Morgan Stanley.
The company’s largest tenant is Amazon (AMZN), which leases 5 properties totaling 1.3 million SF. CUZ derives 9.1% of its annualized rent from AMZN, which has a W.A. remaining lease term of 5.7 years.
Combined, CUZ’s top 20 tenants generate $287.7 million, or 38.2% of its portfolio’s annualized rent and have a W.A. remaining lease term of 6.3 years.
The company released its 2Q-24 operating results in July and reported total revenue during the quarter of $213.0 million, compared to total revenue of $204.3 million in the second quarter of 2023.
FFO was during the quarter was reported at $103.3 million, or $0.68 per share, compared with FFO of $103.0 million, or $0.68 per share for the same period in 2023.
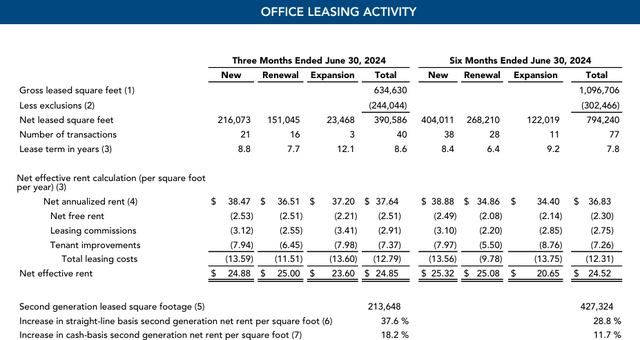
The company executed roughly 391,000 SF of office leases at a net effective rent of $24.85 per SF during the second quarter. The rate per SF in 2Q-24 compares favorably to the net effective rent per SF of $24.56 for FY 2023 and $23.39 for FY 2022.
CUZ executed 213,648 SF of 2nd generation leasing during the second quarter and reported an increase of 37.6% on a straight-line basis, or 18.2% on a cash-basis.
During the second quarter, same-property NOI increased 5.1% on a cash-basis and the company’s weighted average occupancy improved from 87.5% in 2Q-23 to 88.5% as of the most recent quarter.
In April of this year, the company received an investment grade credit rating of BBB from S&P Global and Baa2 from Moody’s. CUZ has strong debt metrics including a net debt to EBITDA of 5.25x, a long-term debt to capital ratio of 37.52%, and an EBITDA to interest expense ratio of 4.53x.
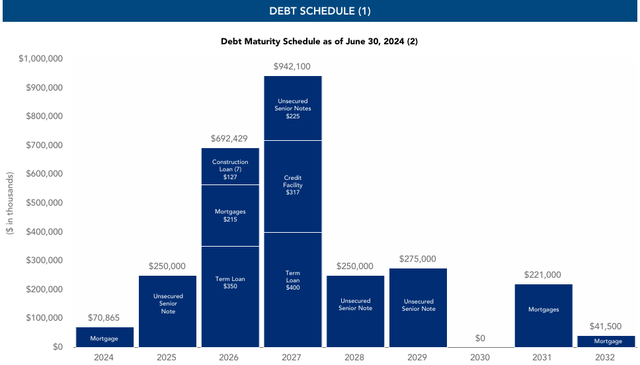
84% of the company’s debt is fixed rate and CUZ’s total debt has a W.A. interest rate of 4.96% and a W.A. term to maturity of 3.1 years. Plus, the company has $713.0 million of liquidity and only 11.8% of its debt matures in 2024 and 2025.
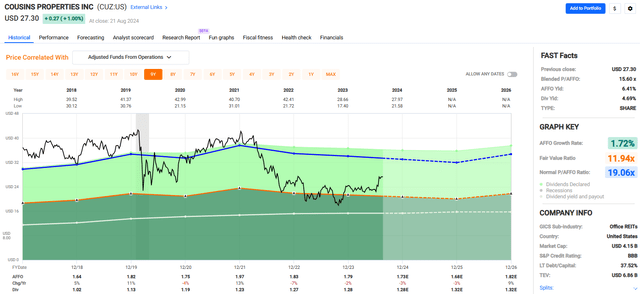
Over the last several years, the company has had an average AFFO growth rate of 1.72% and a compound dividend growth rate of 4.91%. Analysts expect AFFO per share to fall by -3% in both 2024 and 2025, but then for AFFO per share to increase by +9% in 2026.
CUZ pays a 4.69% dividend yield that is well covered with a 2023 AFFO payout ratio of 71.71%. The stock is currently trading at a P/AFFO of 15.60x, compared to its normal AFFO multiple of 19.06x.
We rate Cousins Properties a Strong Buy.
Kite Realty Group (KRG)
KRG is a shopping center REIT that specializes in the development, acquisition, and management of open-air shopping centers and mixed-use assets that are mainly grocery-anchored and located in fast-growing sunbelt markets.
To a lesser extent, the company also invests in retail properties located in select gateway markets such as Washington., D.C., Seattle, and New York City.
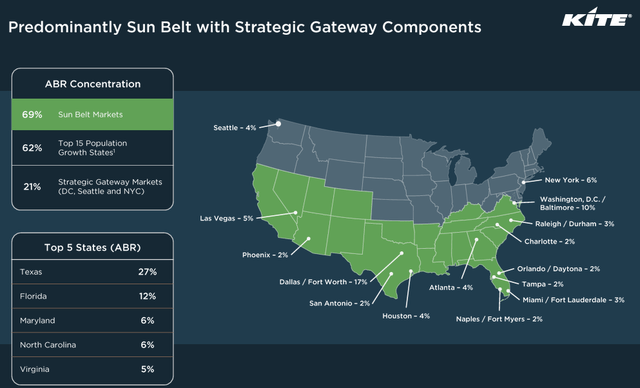
Kite Realty has a market cap of approximately $5.7 billion and a 28.0 million SF portfolio comprising 178 retail properties that are 94.8% leased. Nearly 80% of the company’s ABR is derived from assets with a grocery component, and roughly 69% of its ABR is generated in sunbelt markets.
The company’s top 5 states include Texas, Florida, Maryland, North Carolina, and Virginia. KRG’s largest state is Texas, which makes up 27% of its ABR, followed by Florida and Maryland that make up 12% and 6%, respectively.
KRG’s average property size is 155,000 SF and has strong 3-mile demographics with an average population of 102,000, and average household income of $115,000 within a 3-mile radius of its retail centers.
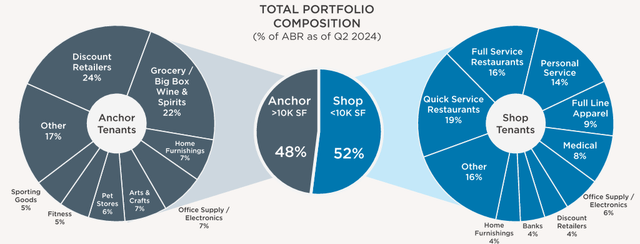
Kite Realty’s portfolio has a diverse tenant mix that receives 48% of its ABR from anchor properties (over 10K SF), and 52% of its ABR from in-line shop properties (under 10K SF).
The company’s anchor revenue is primarily generated by discount retailers and grocers, while its in-shop stores include a mix of service, apparel and restaurant tenants.
The company’s largest category of anchor tenants is discount retailers, followed by big box grocery and wine & spirit stores. Other anchor tenants include home furnishings, pet stores, fitness, and sporting goods.
The company’s largest category of in-line shops includes quick service restaurants (“QSR”), full-service restaurants, and merchants that provide personal services (salon, nails, etc.). Other in-line shops include medical, apparel, home furnishings, and banks.
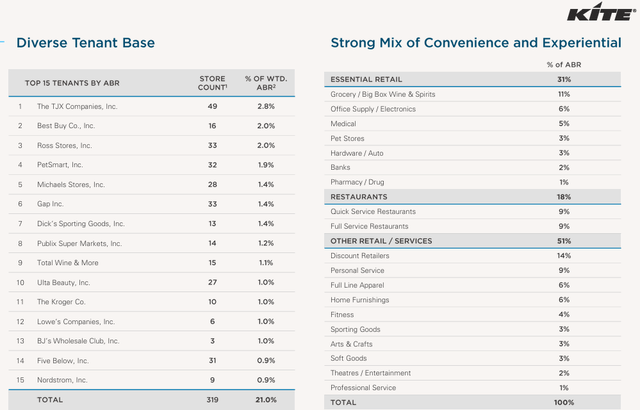
The company has a diverse tenant base that includes leading retailers such as TJX, PetSmart, Ross Stores, Best Buy, Dick’s Sporting Goods, Lowe’s, Kroger, and Publix.
Kite Realty’s top tenant is TJX, which makes up 2.8% of its ABR, followed by Best Buy and Ross Stores that make up 2.0% each. In total, the company only derives 21.0% of its ABR from its top 15 tenants.
The company recently released its 2Q-24 operating results and reported total revenue during the quarter of $212.4 million, compared to total revenue of $208.8 million in the second quarter of 2023.
Nareit FFO during the quarter was reported at $115.5 million, or $0.53 per share, compared to Nareit FFO of $112.2 million, or $0.51 per share in 2Q-23.
During 2Q-24, the company leased roughly 1.2 million SF at comparable cash leasing spreads of 15.6%, received a credit rating upgrade from S&P, improved its leverage, and increased its quarterly dividend by 8.3% year-over-year. Pretty good quarter, I’d say.
The Chairman and CEO of Kite Realty, John A. Kite, made the following statement in the release:
“The KRG team delivered another exceptional quarter with approximately 1.2 million square feet of total leasing volume, while generating 15.6% blended cash spreads. The combination of our superior operating platform and premier open-air portfolio has enabled our team to enhance the quality of our merchandising mix and drive higher embedded rent bumps. S&P and Moody’s recent upgrades reflect the strength of our credit metrics and our commitment to maintaining a formidable balance sheet.”
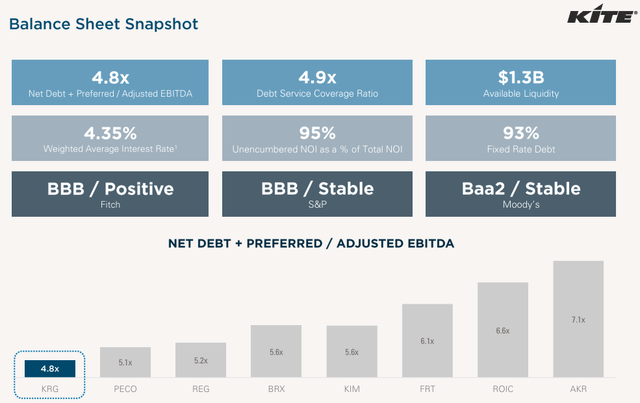
Kite Realty has an investment grade balance sheet with a BBB credit rating from S&P Global and a Baa2 from Moody’s. The company has excellent debt metrics including a net debt plus preferred to adjusted EBITDA of 4.8x, a long-term debt to capital ratio of 46.74%, and a debt service coverage ratio of 4.9x.
93% of its debt is fixed rate and its total debt has a weighted average interest rate of 4.35%. As of the company’s latest update, it had approximately $1.3 billion of available liquidity.
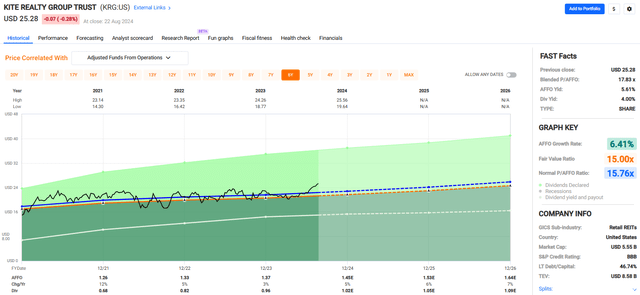
Over the last couple of years, KRG has delivered an average AFFO growth rate of 6.41%. Analysts expect this to continue with projections that AFFO per share will increase by 5% in 2024, and then increase by 6% and 7% in the years 2025 and 2026, respectively.
KRG pays a 4.00% dividend yield that is easily covered with a 2023 AFFO payout ratio of 70.07% and the stock is trading at a P/AFFO of 17.83x, compared to its normal AFFO multiple of 15.76x.
FAST Graphs (compiled by iREIT)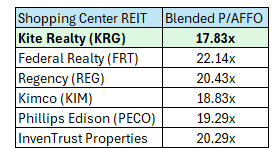
While the stock is trading above its average AFFO multiple, it is trading well below that of its shopping center peers as shown above.
KRG primarily owns shopping centers in coveted sunbelt markets and is expected to grow AFFO between 6-7% over the next few years.
Given the backdrop of limited strip center supply and KRG’s well-positioned portfolio in fast-growing sunbelt markets, we think the stock should trade more in line with its peers and think a 17.83x multiple is warranted.
We rate Kite Realty Trust a Strong Buy.
Sun Communities (SUI)
SUI is a REIT that owns and operates manufactured housing (“MH”), recreational vehicle (“RV”) parks, and marinas in the United States, the United Kingdom, and Canada. The company, together with its predecessors, has been involved in the acquisition, development, and operation of MH and RV communities since 1975 and marinas since 2020.
The company invests in parcels of land, or “sites,” equipped with utility access where MH’s or RV’s can be placed. The company generates revenues from leasing these developed sites to its MH and RV customers.
MH and RV parks offer affordable housing and can be a substitute for single family homes or apartments. Given the trends in housing affordability, the demand for alternative shelter should remain healthy for the foreseeable future.
Sun Communities marinas are located in coastal regions and offer wet slip and dry storage spaces as well as ancillary services such as vessel maintenance, winterization, and repair. SUI looks to provide amenities and services that offer resort-like experiences to its members in order to enhance the value of its marinas.
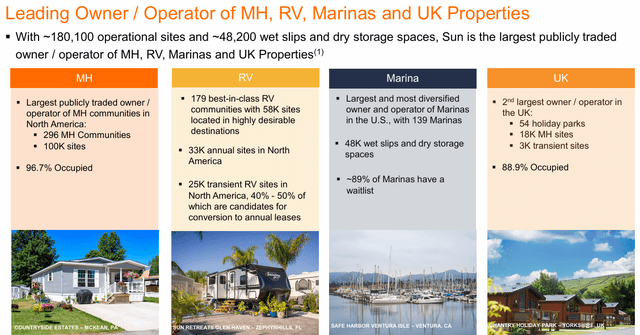
SUI has a market cap of approximately $16.6 billion and a portfolio that includes 666 developed properties comprising over 180,000 operational sites and approximately 48,000 wet slip and dry storage spaces.
These properties include 296 MH communities in North America that have ~100K sites and are 96.7% occupied, 179 RV communities with 58K sites, and 139 marinas with 48K wet slips and storage units.
In the UK, the company is the second-largest MH owner & operator, with 54 holiday parks containing 18K MH sites that are 88.9% occupied.
The company released its second quarter operating results recently and reported total revenue during the quarter of $864.0 million, compared to total revenue of $863.4 million in 2Q-23.
FFO for the second quarter was reported at $230.5 million, or $1.79 per share, compared to FFO of $252.4 million, or $1.96 per share in the second quarter of 2023.
Core FFO during the quarter came in at $238.7 million, or $1.86 per share, compared to Core FFO of $252.9 million, or $1.96 per share for the same period in 2023.
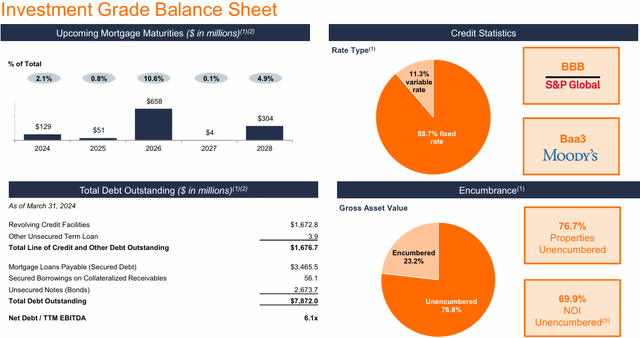
At the end of the second quarter, SUI had $7.9 billion of outstanding debt that had a W.A. interest rate of 4.2% and a W.A. term to maturity of 6.5 years. The company has a net debt to EBITDA of 6.2x, a long-term debt to capital ratio of 53.79%, and an EBITDA to interest expense ratio of 3.68x.
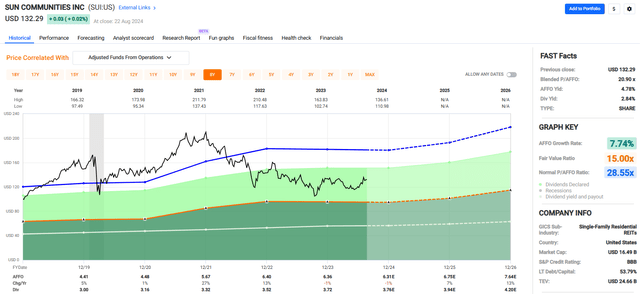
Over the last several years, Sun Communities has delivered a blended average AFFO growth rate of 7.74% and an average dividend growth rate of 5.62%.
Analysts expect AFFO per share to fall by -1% in 2024, but then to increase by 7% in 2025 and then increase by 13% the following year.
SUI pays a 2.84% dividend yield that is well covered with a 2023 AFFO payout ratio of just 58.49% and trades at a P/AFFO of 20.90x, compared to its average AFFO multiple of 28.55x.
We rate Sun Communities a Strong Buy.
In Closing
The “Margin of Safety” concept is not foolproof, yet I consider it one of the most important methods for helping investors separate the wheat from the chaff.
Seth A. Klarman, author of Margin of Safety: Risk-Averse Value Investing Strategies for the Thoughtful Investor, explains,
“There is nothing esoteric about value investing. It is simply the process of determining the value underlying a security and then buying it at a considerable discount from that value. It is really that simple. The greatest challenge is maintaining the requisite patience and discipline to buy only when prices are attractive and to sell when they are not, avoiding the short-term performance frenzy that engulfs most market participants.”
Klarman continues,
“Value investing by its very nature is contrarian. Out-of-favor securities may be undervalued; popular securities almost never are. What the herd is buying is, by definition, in favor. Securities in favor have already been bid up in price on the basis of optimistic expectations and are unlikely to represent good value that has been overlooked.”
I hope that you enjoyed this article, and I look forward to writing similar “Margin of Safety” articles across other income asset classes (BDCs, MLPs, Asset Managers, Banks, Dividend Aristocrats, etc…).
“Price is what you pay; value is what you get.” – Warren Buffett
Author’s Note: Brad Thomas is a Wall Street writer, which means he’s not always right with his predictions or recommendations. Since that also applies to his grammar, please excuse any typos you may find. Also, this article is free: written and distributed to assist in research while providing a forum for second-level thinking.


