cemagraphics
The S&P 500 (SPY) continued its recovery rally back to near the previous all-time high and then dropped sharply on Thursday. A double top? The start of the next big drop?
These are probably the wrong questions to ask when the context is bullish. Surely, the most useful question is, where can I buy the dip? As I will show later, the answer is often simple.
This week’s article will highlight important levels for the S&P 500 to hold on dips. It will also take a close look at the current pattern and speculate what could happen now we are back near all-time highs. Various techniques will be applied to multiple timeframes in a top-down process which also considers the major market drivers. The aim is to provide an actionable guide with directional bias, important levels, and expectations for future price action.
S&P 500 Monthly
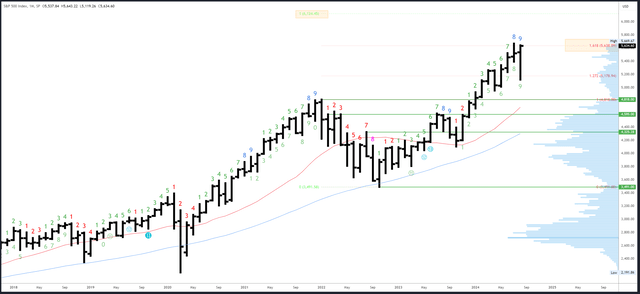
New August highs have been made and with 1 week to go until the monthly close, a bullish bar looks very likely to form. Only a close below, 5390 would shift the bias neutral/bearish.
It was interesting to see the major Fibonacci extension of 5638 (mentioned in most articles since June) still having an effect, as the S&P 500 made a sharp drop from 5643. I’d guess it won’t be the last time this area will be relevant.
5638 and the 5669 top are potential resistance points. The next major target for new highs is the 6124 level. This is a measured move, where the 2022-2024 rally will be equal in size to the 2020-2022 rally. It is unlikely to be reached this side of the election, but is a possible destination at some point in this bull market.
5390 and the August low of 5119 are initial supports.
The August bar will complete the upside Demark exhaustion count. It may have played out already with the correction of nearly 10%, but its effect could linger and limit rallies ahead of the election.
S&P 500 Weekly
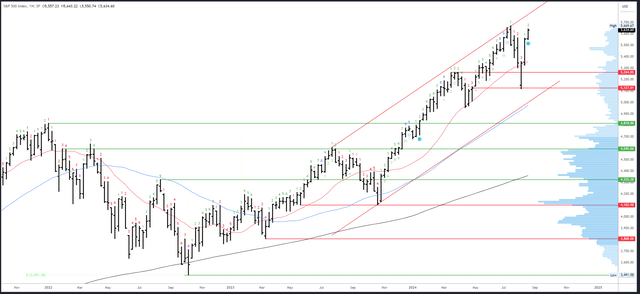
Friday’s recovery saved the weekly bar from shifting bearish/neutral (with a close below the open of, 5557). Another higher low, higher high and higher close were formed, and we now have a clean 3 bar rally off the lows. Markets tend to move in sequences of 3 bars (at least in the weekly and daily timeframes) and often stall on bar 4. The odds favour an initial rally next week but this likely stalls below the 5669-all-time high.
5669 is the only resistance. 6010 is the 161.8* Fibonacci extension of the July-August drop
5550 is initial support. There’s not much compelling weekly support below that until 5324-5358. The 20-week MA will rise to around, 5380 next week.
Next week will be bar 3 (of a possible 9) in a new upside Demark exhaustion count.
S&P 500 Daily
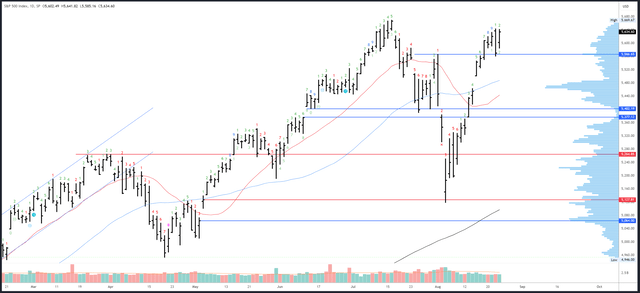
The S&P 500 continues to cut through potential resistance. The 5566 level pointed out last week offered no challenge at all on the way up, and then to rub bears noses in it, acted as support on Thursday’s dip. This was a simple level drawn at the high before the “crash.”
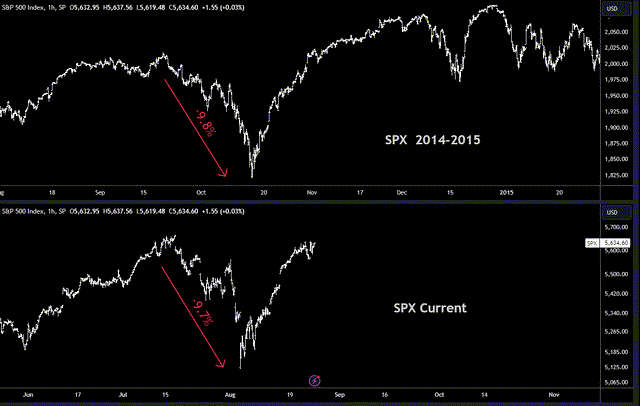
A clear “V” pattern has formed from the July/August drop and recovery. Historical charts reveal the “V” pattern is common for the S&P 500, but the recovery does not usually extend all the way back to the previous high in such a short space of time. November 2023 was similar, but the most compelling comparison of the same scale comes from 2014 when there was a drop of -9.8% which recovered in 3 weeks just like now.
Should the comparison continue, the projected path seems logical heading into the election. A break to new highs is likely, but momentum should fade and gains are likely limited given the backdrop of stretched valuations and slowing growth. Volatility could well pick up in late September and October, with several sharp dips (and rallies).
This is obviously just speculation, and somewhat unnecessary to make winning trades; we only really need to know where the next dip should hold.
5550-5560 is initial support. The gap at 5500 is more important, with the 50dma rising to 5492 in confluence. The 5390-400 area is still relevant, but a return to this area would reflect a weak trend and put the expected break-out in doubt.
An upside Demark exhaustion completed last Wednesday and contributed to Thursday’s dip. No new exhaustion signals can complete next week.
Drivers/Events
Fed Chair Powell used his Jackson Hole speech to confirm a rate cut will happen in September. However, it is still unclear if the cut will be 25bps or 50bps, and the markets still assign a 25% chance of a 50bps move. It all hinges on incoming data, specifically the next Jobs Report, which is due on September 6th.
While it is assumed stock markets would prefer a 50bps cut, this isn’t necessarily the case if it is driven by a deteriorating labour market. Stocks would likely prefer a solid economy and a slower easing cycle.
Next week’s data will be on the quiet side again. Prelim GDP and Unemployment Claims are due for release on Thursday but won’t influence the September FOMC meeting outcome. The PCE Index is due out on Friday and expected to print a benign 0.2%. This would confirm inflation is a fading problem.
Probable Moves Next Week(s)
The bigger picture view remains bullish and a break to new all-time highs is expected in the coming weeks. Only a break below 5500 would compromise the bullish trend, and even then, 5390-5400 could hold for a sideways consolidation.
After three strong weeks, some momentum loss could be expected and a consolidation in the 5550-5669 range would be healthy. That said, the strength of the recent recovery rally is not common and the “V” pattern can be compared to October 2014 which continued to new highs with only very shallow dips. The projected path from this comparison seems logical – an initial break to new highs may continue slowly, but gains are likely limited to 5900-6000 and could fade again closer to the election with a number of sharp falls.
Short-term, Friday’s action projects continuation higher early next week. 5669 is the obvious target and may lead to some mild volatility in what is likely to be a quiet period ahead of the crucial Jobs Report on September 6th.


