


monsitj
In this article, I will provide a 50,000-foot view of the market using the SPDR S&P 500 ETF (NYSEARCA:SPY) as a proxy for the SP 500 index and see if SPY is where I should put my retirement funds. I will compare SPY to the iShares MSCI EAFE ETF (EFA), the Vanguard Extended Market ETF (VXF), and the iShares Core U.S. Aggregate Bond ETF (AGG). It’s been a few months since my last look at the broad market, so let’s see if anything has changed from my last take that SPY was the way to invest moving forward.
Chart 1 – SPY Monthly
www.stockcharts.com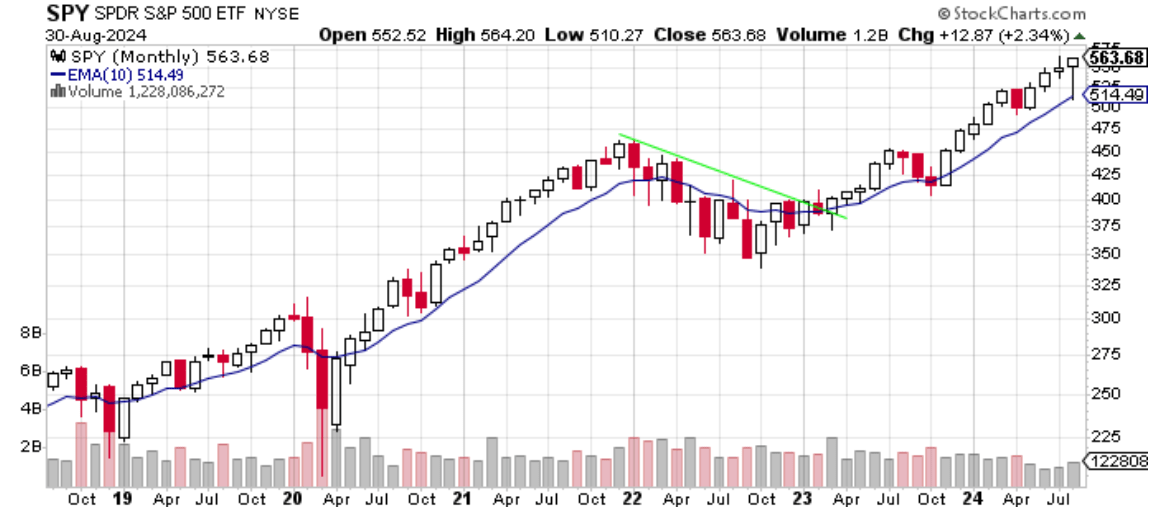
Looking at Chart 1, you can see that SPY is in a clear bullish uptrend. It is above a rising 10-month moving average, and the moving average is trending higher as well. Since the bear market bottom in October 2022, SPY has only had 3 monthly closes below the 10-month moving average. I like to use the 10-month exponential moving average (EMA) as it provides the big picture, 50,000-foot view of the market. You can see that owning the ETF when it trades above the 10-month EMA is a good rule of thumb. When the ETF trades below the 10-month EMA, that is a good time to be out of the ETF. This is not a perfect strategy, but I don’t know of a perfect strategy. I have used this strategy for quite some time, and I think this strategy keeps me out of trouble.
Chart 2 – EFA Monthly with 10-Month EMA
www.stockcharts.com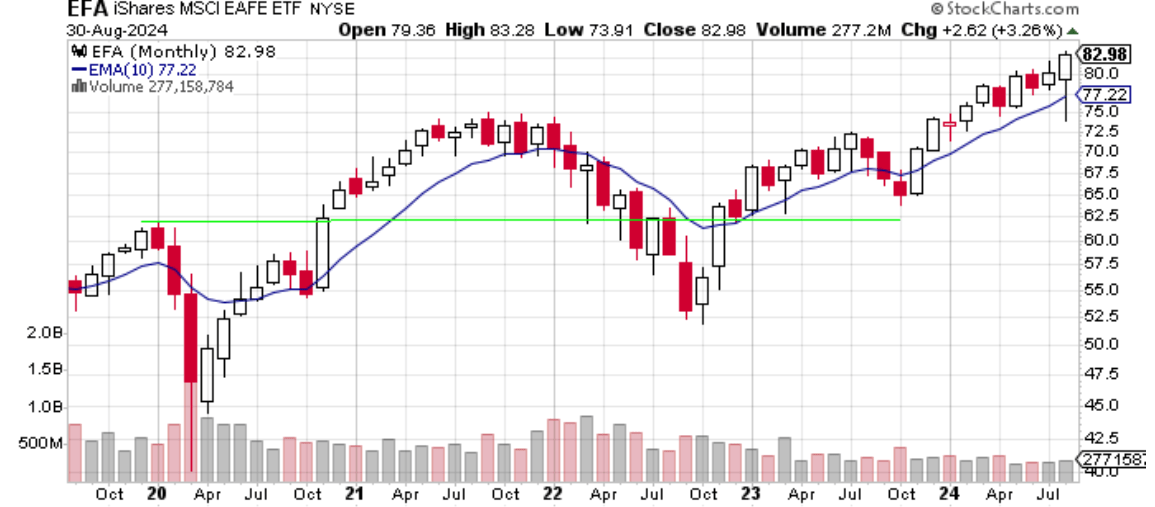
Chart 2 shows that foreign stocks have done well recently. Like SPY in Chart 1, EFA has consistently stayed above an upward sloping 10-month EMA. If you’re a bull, that is what you want to see. EFA has closed at a new high, and new highs are always bullish in my opinion. EFA had an interesting month. You can tell by the lower wick of the candle that at one point in the month, the bears had control of EFA, driving the price lower as EFA reached a low of $73.91. Then things reversed, and the bulls took control of EFA driving the price back to new highs. The reason for the change in direction could be many things. The dollar declined this month, the Jackson Hole speech by Federal Reserve Chairman Powell, or something else altogether. While I don’t know the reason for the bullishness in EFA, I can see the bullishness in Chart 2 and that is why I like to use price and a moving average to get the big picture. EFA is bullish as it is above an upward sloping 10-month EMA, and EFA closed at a new high.
Chart 3 – EFA:SPY Relative Strength with 10-Month EMA
www.stockcharts.com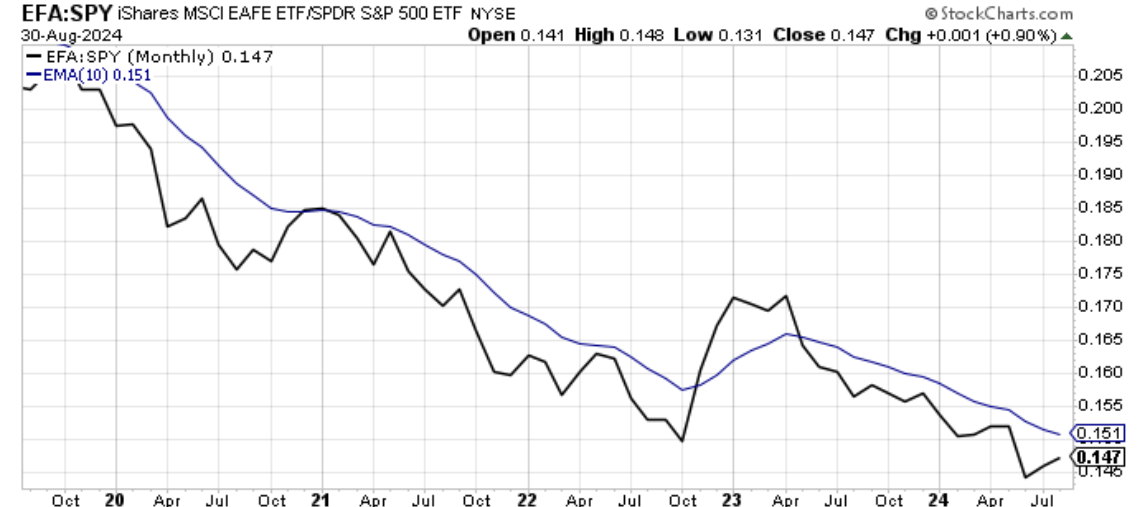
Relative strength charts are outstanding charts to help investors allocate capital. Relative strength charts are easy to understand. The black line in Chart 3 is a ratio of the price of EFA to the price of SPY. When the black line is falling, that means that EFA is underperforming SPY. When the black line is rising, that means that EFA is outperforming SPY. Chart 3 shows that EFA, while doing well in isolation, has been underperforming SPY for over a year. Despite the fact that EFA has been making new highs over the past six months, as shown in Chart 2, an investor who invested in EFA instead of SPY for the past year would have underperformed SPY. Based on what Chart 3 shows, I will keep my money invested in SPY and not put money in EFA until this ratio trades above an upward sloping 10-month EMA.
Chart 4 – VXF Monthly with 10-Month EMA
www.stockcharts.com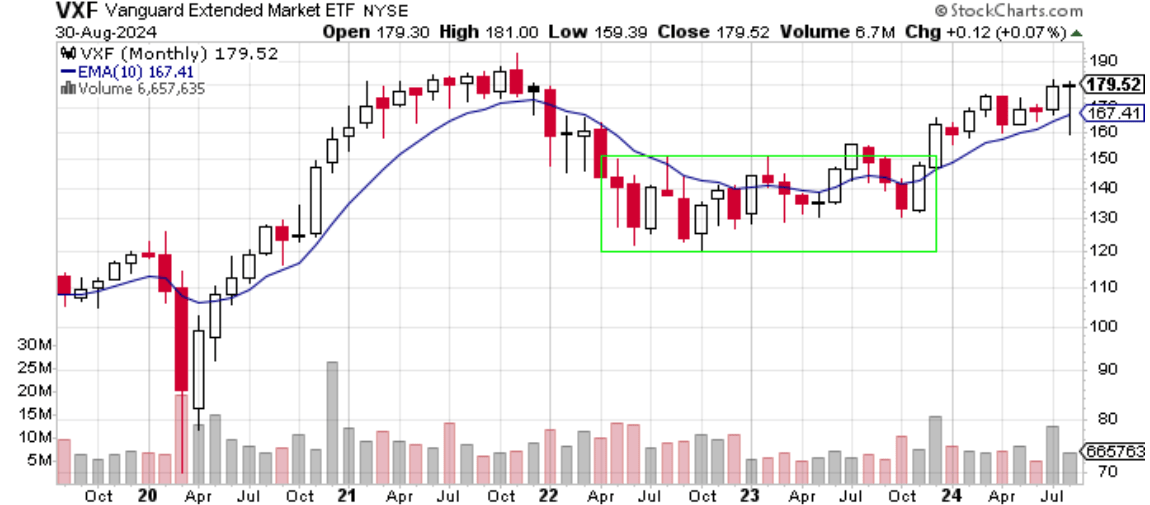
Chart 4 shows the performance of VXF for the month of September. This ETF hasn’t performed well at all in September. VXF managed to have out a minimal gain for the month of September. VXF had the same candle pattern that SPY and EFA had for September. The lower wick on the monthly candle shows selling pressure that eventually dissipated. And, like SPY and EFA, VXF is trading above an upward sloping 10-month EMA, which is bullish. Unlike EFA and SPY, however, VXF wasn’t able to close the month higher. It is also interesting to see that VXF hasn’t reached a new high in almost three years. Investors have preferred paying up for larger capitalization stocks that are found in SPY or EFA.
Chart 5 – VXF:SPY Relative Strength with 10-Month EMA
www.stockcharts.com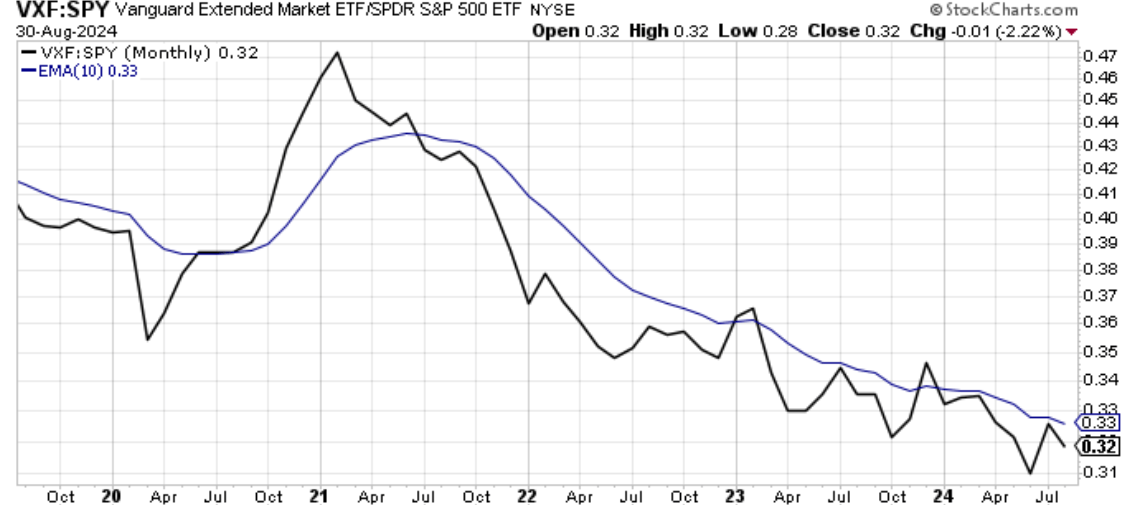
It should be no surprise that Chart 5 shows that VXF is underperforming SPY. Since SPY is trading at new highs and VXF hasn’t seen a new high in quite some time that was a big clue. Eventually, this underperformance will change, and until then, I will not invest in VXF over SPY.
Chart 6 – AGG Monthly with 10-Month EMA
www.stockcharts.com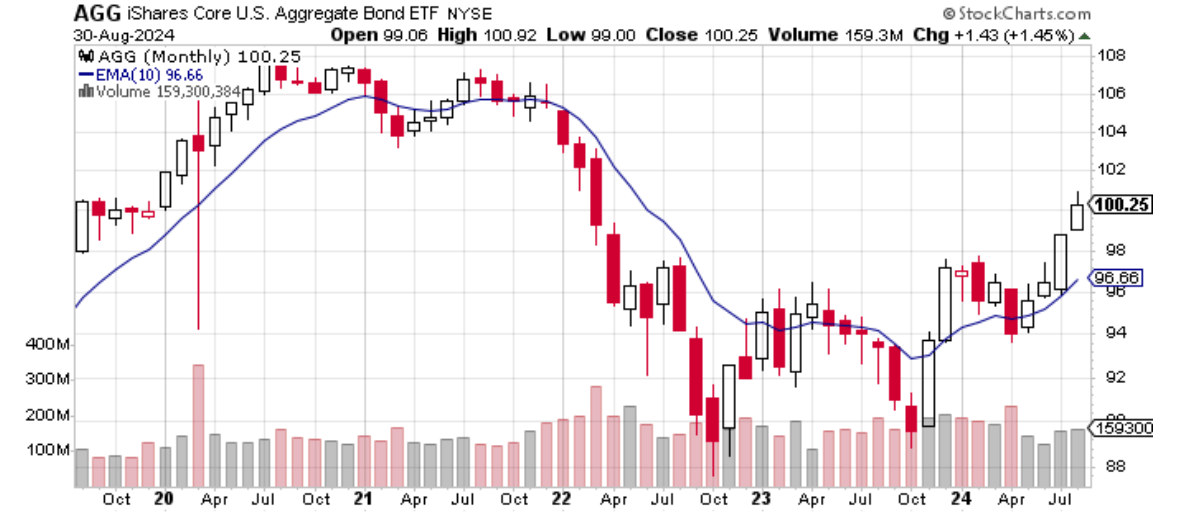
With all the talk about lowering interest rates, it’s not surprising that AGG did well in September. AGG was 1.46% higher in September, and AGG has risen 6.58% since the end of April. AGG is trading above its 10-month EMA and the EMA itself is trending higher, which makes AGG bullish in my opinion. AGG is also putting in a series of higher lows and higher highs, which is the definition of an uptrend. The October 2024 low is higher than the October 2023 low. The April 2024 low is higher than the October 2024 low. The February 2024 high is higher than the May 2023 high. The August close is higher than both of the previous highs. A new uptrend has been established.
Chart 7 – AGG:SPY Relative Strength with 10-Month EMA
www.stockcharts.com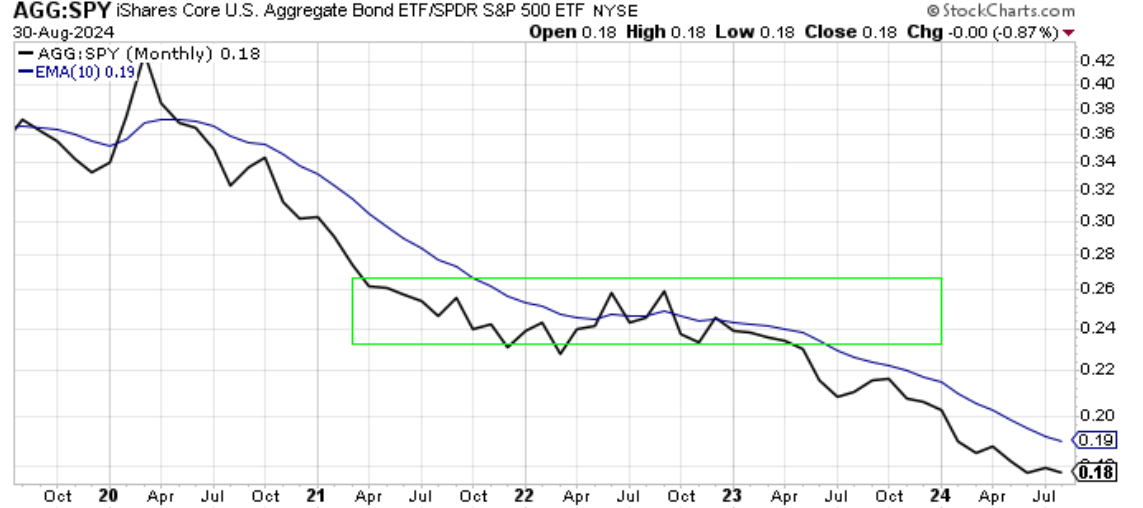
As mentioned before, just because an asset is performing well in isolation, that doesn’t mean it is the best place to put your money. Chart 7 shows that investors still prefer equities to debt. While that may in the future, right now, it is better to invest in SPY as opposed to AGG.
In summary, SPY, EFA, VXF and AGG are all trading above their upward sloping 10-month EMAs. In isolation, they are all bullish. However, Charts 3, 5, and 7 show that SPY is outperforming EFA, VXF, and AGG on a relative basis. So, not much has changed since my last look at the broad market. I am keeping my money in SPY until things change.
