Monthly Update
Leverage. If you blinked, you may have missed it. The tremors of volatility that characterized the second half of July permeated right through to the beginning of August. In a year that has been uncharacteristically calm, the major stock market averages experienced a swoon in the first week of the month. At fault is leverage.
Conventionally, when people think of leverage in the stock market, they think of broker-provided loans called margin loans, whereby customers of the brokers borrow money to purchase stocks, but that is not the case here. The leverage that we are talking about may be foreign to you, literally, it comes from Japan.
On August 5th, the major Japanese stock market index, the Nikkei plunged -12%, and in a sympathetic move, our most popular stock market index, the S&P 500, dropped -3%. Behind the scenes of this unfolding thriller was a black swan event called, the Japanese yen carry trade.
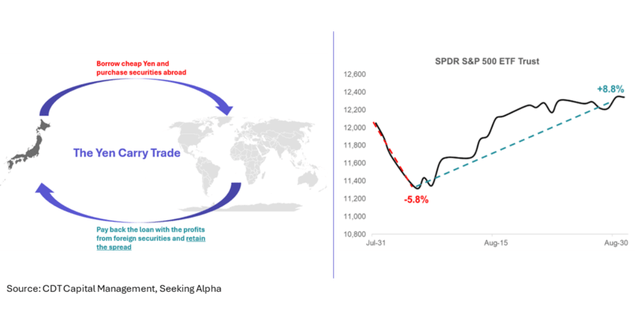
At its core, a carry trade is a bit of financial engineering creativity in which traders all over the world borrow money in one country and purchase securities in another country. Like any trade on margin, the trader must earn more on the purchased securities than the cost of borrowing the money, the spread between these amounts is the profit.
A popular carry trade starts in Japan, a country that has historically maintained a low-interest rate environment, allowing traders from all over the world to confidently borrow very cheap money from Japanese financial institutions.
These traders then purchase securities across the globe. For example, a trader may borrow money at 1% in Japan and purchase a U.S. treasury yielding 4% in the United States. All things being equal, the trader hopes to take home the 3% spread.
As of June, authorities in Japan estimated that nearly a half a trillion dollars was borrowed to finance these types of trades – an amount so large that I had to do a double-take on my screen!
This massive borrowing can wreak havoc in financial markets and partly explains how $6.4 trillion in global stock market value was destroyed between the last two weeks of July and the first week of August when confidence in this trade wobbled.
It also suggests that speculators were not just using their Yen loans to purchase safe assets like treasuries, but also using funds to purchase stocks on margin – a very dangerous game.
In July, in response to economic pressures, particularly inflation, the Japanese central bank raised interest rates from 0.05% to 0.25% for the first time since 2007. Instantly, the Yen carry trade with $450B on its back became less profitable.
Then, just a few weeks later, the central bank signaled another hike in the coming months, and whoa! – the global system threw a tantrum. So much so, that the central bank had to quickly walk back that position or risk a financial calamity.
For now, walking back those comments seems to have placated markets and in combination with some positive economic news in the U.S., amazingly, global stocks not only recovered, but jumped +8.8% from the August lows.
Sometimes it feels like the stock market has the unimpressive memory of a goldfish. Just last week, the Japanese central bank Governor, Kazuo Ueda, reiterated his readiness to hike rates to combat inflation, signaling that potentially we will have to revisit this topic once more in the near future.
Above the Clouds
Our strategy thrives on these episodes of volatility, in fact, I do not think it is farfetched to assert that our success depends on their regular occurrence. Thankfully, most of the time, volatility is the rule in the stock market, not the exception.
At the core, our thesis is that insiders exploit their information advantage over the rest of the market when they see their business headed north and their stock headed south. This mismatch happens less frequently when markets are steadily marching higher, but when the market’s foundation shakes, new opportunities inevitably fall out.
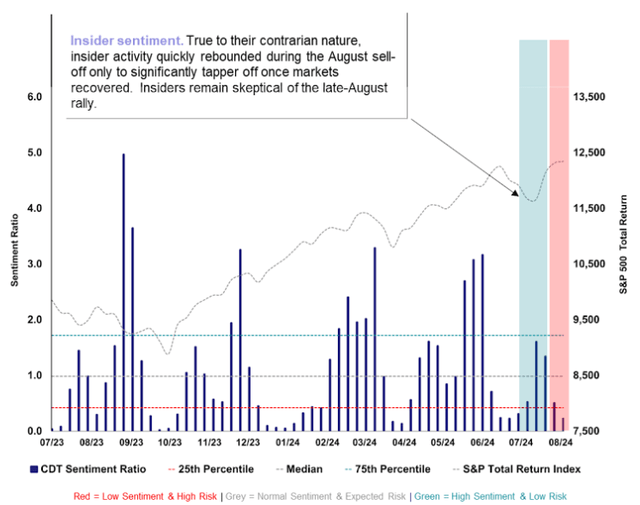
True to their contrarian nature, insider activity quickly rebounded during the August selloff and although sentiment never quite reached exuberant levels, it was enough to arm us with 13 new positions across a myriad of diverse industries and backgrounds.
To name a few, in the semiconductor space, we took small positions in NXP (NXPI) and Mobileye Global (MBLY). In travel and leisure, we jumped into MGM Resorts (MGM). On the other end of the spectrum, we were delighted to pick up Energy Transfer LP (ET) and Clearway Energy Inc. (CWEN) in the utilities category.
The breadth and the under-representation in the S&P 500 of these new positions is what we rely on to ensure our returns remain stable, above average, and less correlated to broader indices.
Secondly, these bouts of volatility allow us to flex our risk management skills. Our quantitative framework is constantly underwriting the risk environment in which we operate. Utilizing a cacophony of datapoints like macro level insider sentiment, economic indicators and valuation, we look at the world in a continuum of risk and allocate our partner capital accordingly.
This approach helped insulate us during the worst of the market sell-off and allowed us to deploy that sidelined capital in our new and existing positions at prices we believe to be exceedingly favorable.
As a result of the August market turbulence, our reserve fell from approximately 16% of assets down to less than 11% at its low. Currently, as volatility has subsided, valuations have recovered, and insider activity has declined. Accordingly, we are taking measured steps to increase our reserve.
This powerful combination of insider signals and reserved capital has helped us successfully navigate all kinds of market volatility. For those in the market that are heavily leveraged or executing a carry trade, market volatility is not just dangerous, it can be disastrous.
For us, our process weaponizes volatility to our advantage by seeking opportunity in the chaos. We planted a lot of seeds in August and look forward to them blossoming in the coming months but remain vigilant to market risks and look forward to updating you again in October.

How it Works
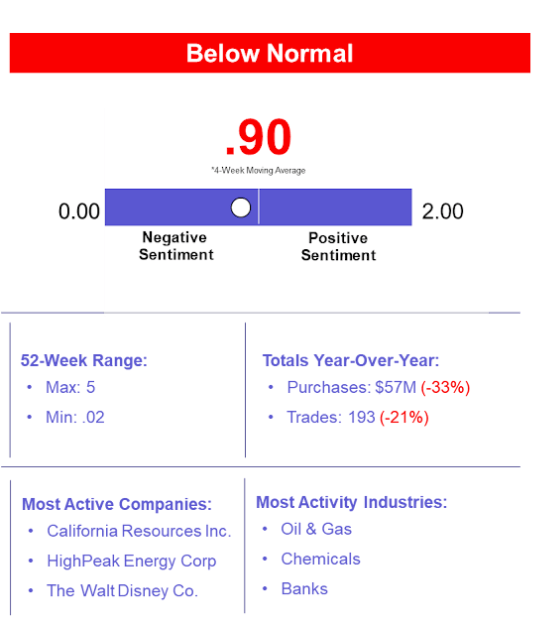
Objective: Predictive model that measures the historical relationship between insider sentiment and the future probability of downside volatility (risk).
Insider Trading Activity: Purchase activity of an insider’s own stock filtered by proprietary parameters to scrub noisy data.
Insight: Executive-level insider sentiment is an indicator of near-term financial market risk.
– Low executive sentiment suggests a high level of risk.
– High executive sentiment suggests a low level of risk.
Scale: A ratio of current insider trading activity in relation to historical patterns.
– (0 to ∞) with a historical median measure of 1.
– Below 1 implies an above normal level of risk.
– Above 1 implies a below normal level of risk.
Frequency: The measure is updated daily and has historically been subject to swift and possibly extreme shifts.
*This webpage is updated monthly and provides just a snapshot of the most recent month-end.
Disclosures
This presentation does not constitute investment advice or a recommendation. The publisher of this report, CDT Capital Management, LLC (“CDT”) is not a registered investment advisor. Additionally, the presentation does not constitute an offer to sell nor the solicitation of an offer to buy interests in CDT’s advised fund, CDT Capital VNAV, LLC (“The Fund”) or related entities and may not be relied upon in connection with the purchase or sale of any security. Any offer or solicitation of an offer to buy an interest in the Fund or related entities will only be made by means of delivery of a detailed Term Sheet, Amended and Restated Limited Liability Company Agreement and Subscription Agreement, which collectively contain a description of the material terms (including, without limitation, risk factors, conflicts of interest and fees and charges) relating to such investment and only in those jurisdictions where permitted by applicable law. You are cautioned against using this information as the basis for making a decision to purchase any security.
Certain information, opinions and statistical data relating to the industry and general market trends and conditions contained in this presentation were obtained or derived from third-party sources believed to be reliable, but CDT or related entities make any representation that such information is accurate or complete. You should not rely on this presentation as the basis upon which to make any investment decision. To the extent that you rely on this presentation in connection with any investment decision, you do so at your own risk. This presentation does not purport to be complete on any topic addressed. The information in this presentation is provided to you as of the date(s) indicated, and CDT intends to update the information after its distribution, even in the event that the information becomes materially inaccurate. Certain information contained in this presentation includes calculations or figures that have been prepared internally and have not been audited or verified by a third party. Use of different methods for preparing, calculating or presenting information may lead to different results, and such differences may be material.
Editor’s Note: The summary bullets for this article were chosen by Seeking Alpha editors.


