:max_bytes(150000):strip_icc():format(jpeg)/MUChart-d4e347a2e8914a69913b22cb0392d84b.gif)
Key Takeaways
- Micron shares could remain in focus on Tuesday after leading a broad chip rally to start the week amid optimism that robust AI demand will continue to drive sector growth this year.
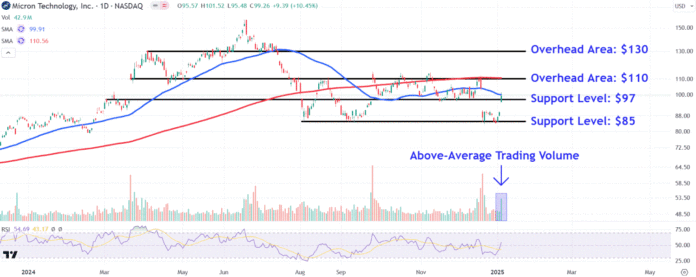
- The stock rallied from a key support area on the highest trading volume since mid-December, indicating buying conviction behind the move.
- Investors should watch key overhead areas on Micron’s chart around $110 and $130, while also monitoring important support levels near $97 and $85.
Micron Technology (MU) shares could remain in focus on Tuesday after leading a broad chip rally to start the week amid optimism that robust artificial intelligence (AI) demand will continue to drive sector growth this year.
The move Monday came after contract electronics manufacturer Foxconn posted record fourth-quarter revenue driven by booming demand for AI servers, while Microsoft (MSFT) recently announced plans to invest $80 billion in data centers in fiscal 2025 to power AI technology.
Micron, a manufacturer of memory chips, stands well positioned to benefit from surging AI infrastructure demand as its silicon is used in the latest AI processors from chipmaking giants such as Nvidia (NVDA) and Advanced Micro Devices (AMD).
Micron shares jumped 10.5% on Monday to close at $99.26. In just three trading sessions this year, the stock has gained 18%, handily outpacing the iShares Semiconductor ETF’s (SOXX) 6% return over the same period.
Below, we take a closer look at Micron’s chart and use technical analysis to identify price levels worth watching.
Stock Rallies From Key Support Area
Since bottoming out in early August, Micron shares have remained rangebound, helping to establish easily identifiable support and resistance levels on the chart.
More recently, the stock gapped lower in mid-December, but immediately found buying interest near the August and September swing lows. Importantly, Monday’s rally from this key support area occurred on the highest trading volume since mid-December, indicating buying conviction behind the move.
Let’s identify several key overhead areas that could come into play if the stock continues its upward momentum and also point out a couple of important support levels that may attract support during dips.
Key Overhead Areas to Watch
Follow-through buying could see the shares move up to the $110 level, a location where they may run into overhead resistance near the 200-day moving average and a trendline that links multiple peaks and troughs on the chart between March and December.
A more bullish advance may fuel a rally to the $130 level. Investors could look for exit points in this area near the April peak, which also sits alongside a range of comparable prices on the chart from May to July.
Important Support Levels to Monitor
During retracements, investors should initially monitor if Micron bulls can defend the $97 level. This area, currently sitting just 2% below Monday’s closing price, could encounter support near a horizontal line that connects a range of comparable price action on the chart dating back to early March.
Finally, a breakdown below this level could see the shares revisit lower support around $85. Investors may look to accumulate stock in this region near last month’s low, which aligns with the prominent August and September troughs.
The comments, opinions, and analyses expressed on Investopedia are for informational purposes only. Read our warranty and liability disclaimer for more info.
As of the date this article was written, the author does not own any of the above securities.


