


Kris Hoobaer
NVIDIA Corporation (NVDA), the Magnificent 7, and the NASDAQ 100-Index (NDX) are peaking and have all the markings of a generational stock market peak like 1929, 1974, and 2000. Our concern is based on market psychology and earnings growth deceleration. Specifically, the parabolic price action — noted in our July 8th letter titled “The Final Stages of a Mega Cap Blow Off” – combined with decelerating earnings growth at NVDA, renewed market complacency, increasing signs of economic moderation, and slowing earnings in the S&P 500 could signal a market peak.
Nvidia’s decelerating earnings growth to be reported on August 28th and impending multiple collapse could trigger a market top that could broaden as we head into the historically fraught market months of September and October. NVDA’s spectacular earnings growth and high expectations suggest its shares are priced to perfection. If this parabolic market leader’s earnings decelerate, a valuation multiple collapse could ensue as soon as this Wednesday, when Nvidia reports its earnings after the close. Decelerating growth at Nvidia combined with renewed market complacency, increasing signs of economic moderation, and slowing earnings in the S&P 500 could reverse the positive feedback loops. This could drive Nvidia, the Magnificent 7, the NASDAQ 100, and the S&P 500 (SP500) into negative feedback loops and potentially a severe market decline this fall.
While Nvidia will likely report strong earnings growth, revenue growth, and positive forward guidance, after six quarters of positive surprises, we believe that the upside opportunity in NVDA shares is shrinking due to its decelerating rate of earnings growth. Nvidia’s decelerating earnings growth will lead to multiple contraction and Nvidia’s shares peaking. Companies that enjoy accelerating growth are not bounded by normal market multiples on earnings or revenue, as has been the case with NVDA. Consequently, accelerating growth companies can enjoy extraordinary price runs that become parabolic, such as NVDA’s shares have experienced since they bottomed in November 2022. That was when ChatGPT was introduced and the investing public was wowed by the incredible possibilities artificial intelligence could offer. NVDA’s shares rose 11-fold in 20 months, with commensurate earnings and revenue growth, and is demonstrative of parabolic or accelerating price action seen in every market bubble and fad since the Dutch Tulip bulb mania which occurred from 1634 to 1637.
Nvidia’s Parabolic Rise:
The chart below of NVDA shows its accelerating share price rise from July 2023 to June 2024. Accelerating or parabolic price rises are emblematic of market peaks, bubbles, and manias which precede severe price declines.
Nvidia’s parabolic stock chart (Yahoo Finance)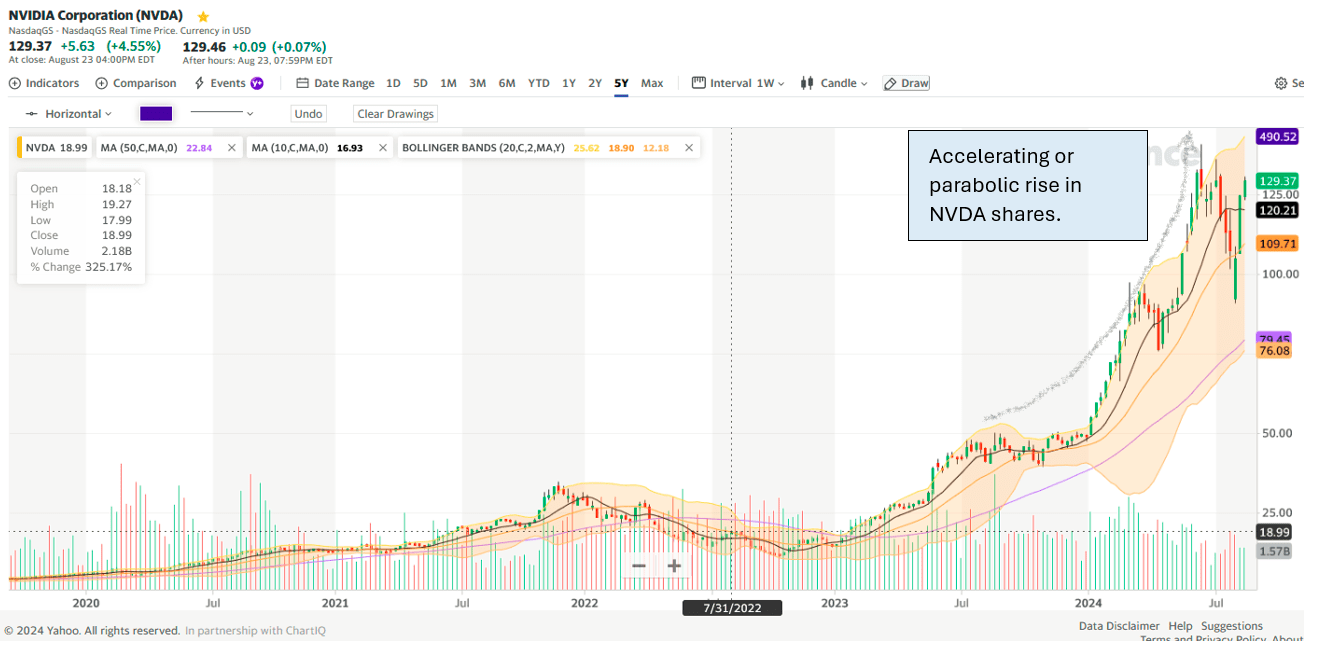
Robert Shiller’s classic book “Irrational Exuberance,” first published in March 2000, highlighted the history of market bubbles enveloping a public mania. This is where investors succumb to a belief in a future so bright that price action accelerates as sellers stop selling their shares and buyers pay up for shares regardless of valuation. We believe that today’s market behavior meets the psychological definition of irrational exuberance just at the time when Nvidia’s earnings growth is beginning to decelerate and a price-earnings multiple collapse is likely to ensue. Nvidia is the poster child for artificial intelligence (“AI”) and a slowing in Nvidia’s earnings momentum will likely turn the positive price action in Nvidia, the Magnificent 7, NASDAQ 100, and S&P 500 downward.
The Magnificent 7:
The chart below of the Roundhill Magnificent Seven ETF (MAGS) shows the parabolic rise in MAGS from April into July when NVDA shares broke their accelerating move higher.
Roundhill Magnificent 7 ETF (MAGS) chart (Yahoo Finance)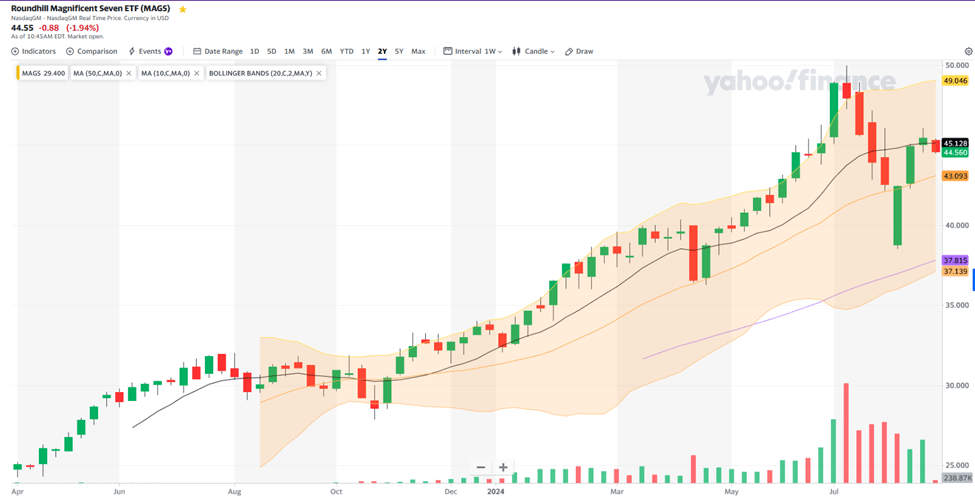
NVDA derives a significant portion of its chip demand from artificial intelligence behemoths Amazon.com, Inc. (AMZN), Microsoft Corporation (MSFT) and Alphabet Inc. (GOOG) (GOOGL). Consequently, any weakness in NVDA expectations will likely be perceived as a weakness in the technology sector and Magnificent 7 stocks in particular. This summer, from peak to trough, NVDA declined 35.57%, the MAGS ETF declined 22.5%, the NASDAQ 100 ETF declined 15.90%, and the S&P 500 ETF pulled back 9.71%.
The concentration of the Magnificent 7 (and large-cap growth stocks) in the S&P 500 has never been higher. Consequently, Nvidia’s earnings will impact the Magnificent 7, the NASDAQ 100, and the S&P 500 meaningfully. Nvidia became the global equity market leader, AI bellwether, and tectonic technology titan when its market capitalization became the world’s largest on June 18th, 2024.
Below is a dataset showing the peak-to-trough declines this summer in NVDA, MAGS, QQQ, and SPY.
Summer Tech Swoon Perspective (IGA research)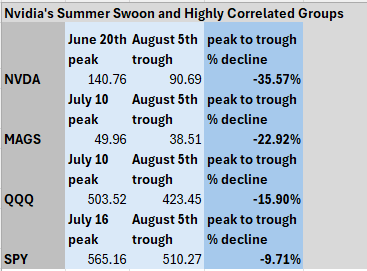
We expect that Nvidia’s earnings Wednesday will reverberate through the Magnificent 7, the NASDAQ 100, and the S&P 500.
NASDAQ 100:
The chart below of the Invesco QQQ Trust ETF (QQQ), which tracks the NASDAQ 100 index, also shows an accelerating and unsustainable rate of appreciation for the large-cap growth index. We believe the current market peak resembles the 2022 peak when the NASDAQ 100 and S&P 500 put in sharp declines. We correctly identified the shift to a bear market in our February 4, 2022, letter titled “The Market Crack Heard Around the World.”
The chart below shows the NASDAQ 100 price acceleration from March 2020 to January 2022, 2022 bear market commenced, followed by the current bull market resumption and blow-off.
NASDAQ 100 chart (Yahoo Finance)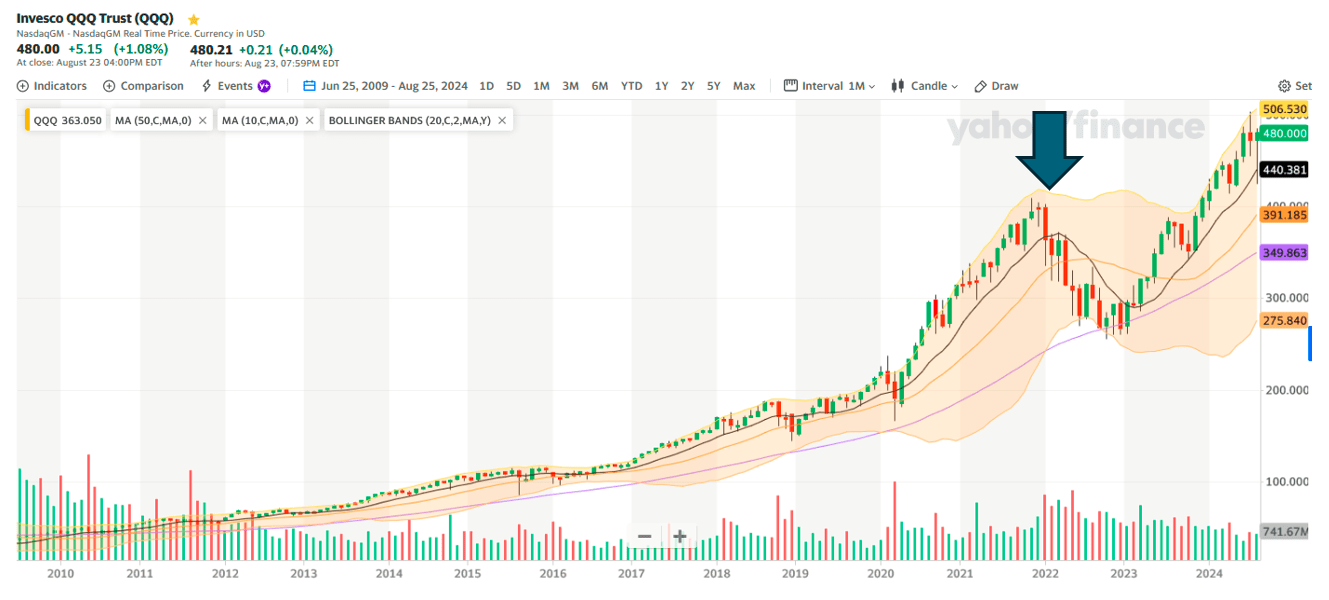
S&P 500:
The S&P 500 has also become extended, as shown in the chart below of the SPDR S&P 500 ETF Trust (SPY). The broad market could become quite vulnerable if recent signs of economic slowing lead to a recession when earnings decline and the S&P 500 follows its earnings.
Recent economic indicators in employment like the Sahm rule, which was triggered on August 2nd, and last week’s revision of 818,000 fewer jobs over the last year, combined with growing consumer credit card debt and weak ISM manufacturing numbers, suggest that economic strength is shrinking. While election year markets tend to do well and the Federal Reserve is turning dovish, economic recessions typically trigger a 30% market decline.
The chart below of the S&P 500 ETF looks like a double-top formation, a harbinger of a potential decline, in the benchmark equity index.
S&P 500 Chart (SPY) (finance.yahoo.com)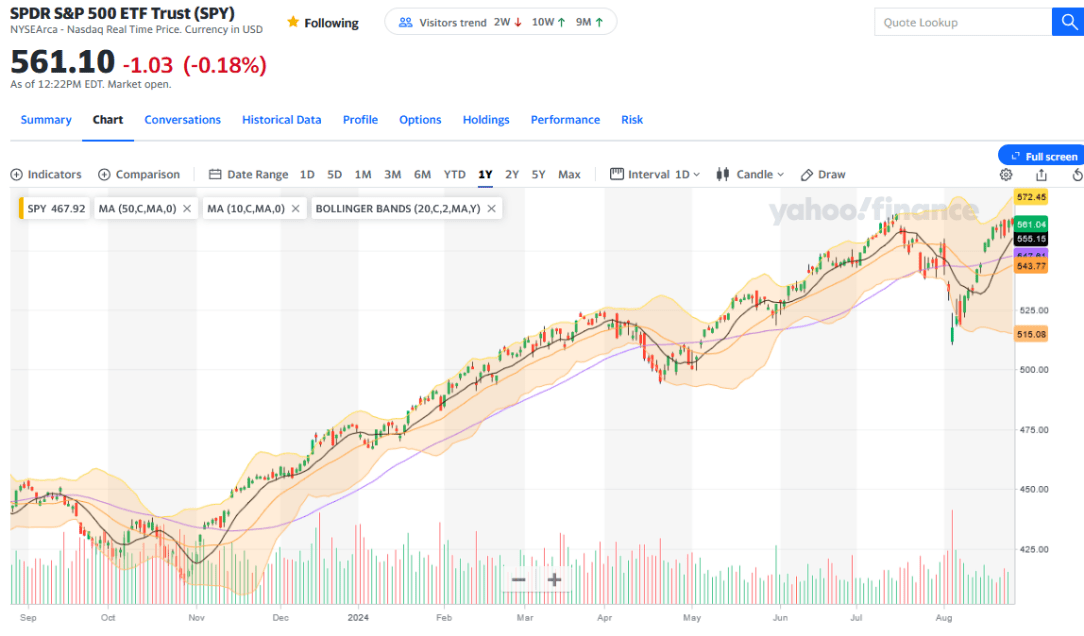
Earnings for the S&P 500 also appear to be peaking like the charts for NVDA, MAGS, the QQQs, and SPY.
Equity market prices track earnings closely and typically rise when earnings rise. The chart of the trailing twelve months’ earnings, in the chart below, has enjoyed a nice rebound since the 2022 decline in the S&P 500. The Fed Model Risk Premium chart below shows the earnings in the red line in the middle pane. The earnings line has recently started to exceed 2020 levels, but this recent rise has started to pause in the last few weeks.
Federal Reserve Risk Premium Model (Portfolio123.com)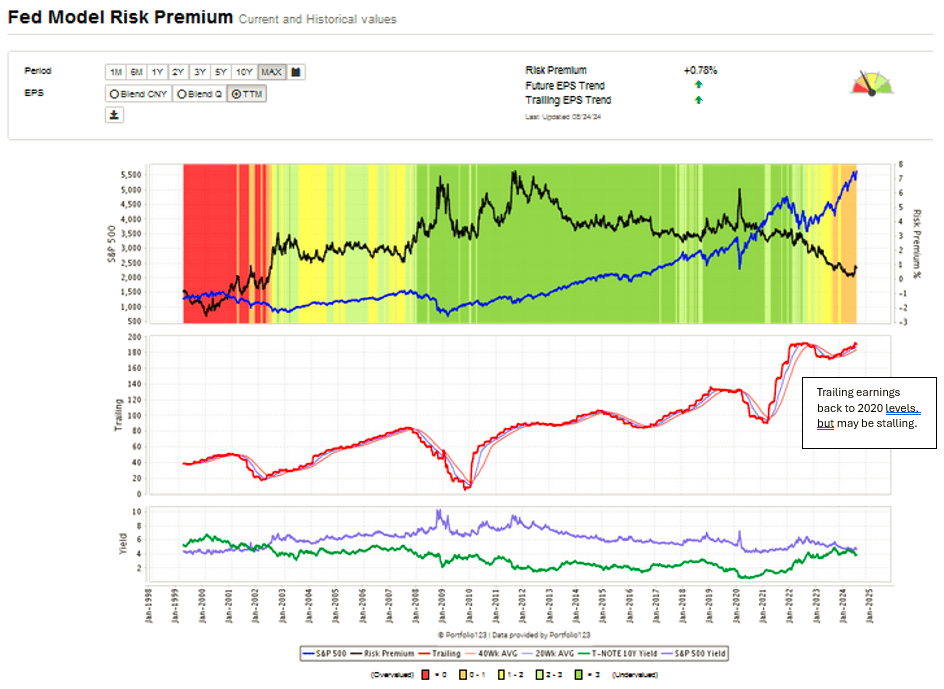
The dataset spreadsheet below shows S&P 500 earnings — trailing twelve months, blended earnings, current year earnings, and expected earnings have stopped rising in the last three or four weeks. Should those earnings start to decline with a slowing economy, the S&P 500 could be at risk. The last four weeks’ S&P earnings are highlighted in a cautionary amber.
Earnings on S&P 500, trailing, blend, forward. (Portfolio123.com)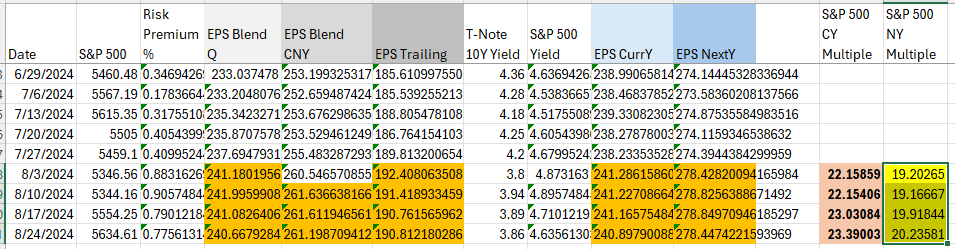
The Fed to the Rescue!
Since the 1990s, markets have grown comfortable knowing that the Federal Reserve will provide monetary accommodation whenever the stock market or economy gets into trouble. With the Federal Reserve telegraphing a likely easing in the Fed Funds rate in September, the prospect of additional market stimulus may already be priced into the market.
The converse to this classic Fed easing market buy signal is when the market is oversold, investors are panicking, and the economy appears doomed. That superior signal occurred in March 2020, during the COVID-19 crash, when we wrote “Irrational Pessimism.”
Fed Funds Rate since 2019 (FRED Database St. Louis)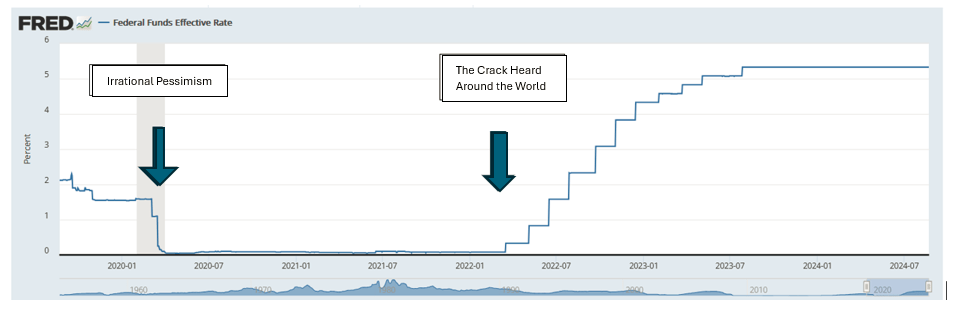
Complacency Goeth Before a Fall!
Man is a herd animal. Consequently, market behavior repeats itself regardless of what type of asset is traded, be it commodities, tulip bulbs, stocks, or bonds. With the recent dovish commentary by Fed Chairman Jerome Powell, we believe the recent retracement in the CBOE Volatility Index (^VIX) index is consistent with a complacent market consensus we are dubbing “complacency goeth before a fall” based on the Proverbs 16:18 “Pride goes before destruction, and a haughty spirit before a fall.”
In the chart below of the S&P VIX Index (VIX), we observe periods of low VIX readings before the sharp market declines in 2020 and 2022. We believe today’s low 16.5 reading is a warning that the market is at risk and that the sharp August 5th decline is a warning of serious equity market risk in the coming months and quarters.
Chart of VIX since 2019 (finance.yahoo.com)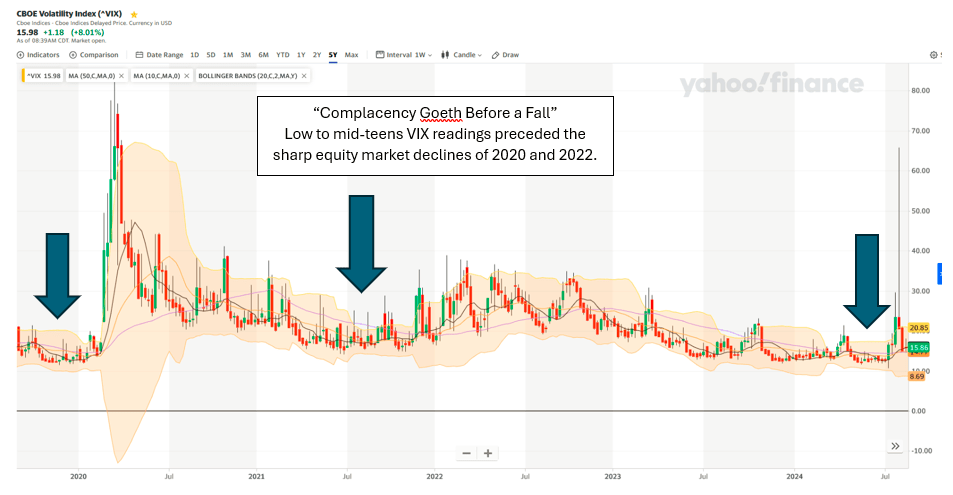
Nvidia’s Declining Earnings Momentum:
The chart below shows the decelerating growth rate in NVDA’s earnings. Q1 2025 EPS reported May 2024, were up 262.12%, but were slightly below the 265.28% earnings comparable reported with Q4 2024 reported January 28, 2024.
History of earnings momentum for NVDA (Seeking Alpha and IGA Research)
More importantly, earnings to be reported on Wednesday should comp at 137% in the quarter, a noticeable decline in earnings growth from the preceding two earnings comps. Q3 2025 should show a further deceleration to a 76.81% earnings per share growth rate followed by Q4 2025 52.27% earnings comp growth rate and followed then by a 37.46% earnings growth rate in Q1 2026. This level of earnings deceleration should lead to a material multiple decline.
Why Nvidia’s earnings will decline is primarily a matter of the law of large numbers. However, our innate recency bias would have us believing NVDA will continue to grow at a 265% annualized rate forever. Consider what would happen if earnings growth continued at 265% per annum for two years. That growth rate would imply Nvidia’s current market capitalization of $3.18 trillion would grow to $11.6 trillion in one year — if it trades at the same market multiple. The market capitalization would soar to $42.36 trillion in two years – if its current price-earnings multiple remains constant. A $42 trillion prospective valuation for Nvidia is absurd! Nvidia’s market capitalization would exceed the gross domestic product of the United States! While we may see an earnings beat to Nvidia’s estimated $0.64/share on Wednesday and an upward revision to future earnings, Nvidia’s growth rate will likely moderate from its 262% comp rate, and momentum investors will dump the stock.
Given that computerized trading represents about 80% of trading, once Nvidia’s earnings are released, the odds are high that momentum traders will begin selling their shares of NVDA, the Magnificent 7 stocks, QQQs, and the S&P 500. Furthermore, these stock groups will likely experience further price weakness when NVDA reports its third quarter when its earnings deceleration is expected to increase further.
Nvidia is having fundamental problems that are also likely to slow the company’s future growth rate. Nvidia’s next-generation Blackwell chip is experiencing design issues which may delay its next-generation chips one year. Despite the Blackwell chip delays which are likely to ensue and slow earnings growth, these technical issues should exacerbate the company’s earnings growth deceleration and further increase selling in NVDA’s shares.
Nvidia has enjoyed industry-leading success and premium pricing, which has driven the company’s shares’ spectacular rise. Unfortunately, high margins in a free market system breeds competition which will reduce those high margins. AMD is working to take market share in the AI chip space and even Amazon is looking to design its own chips. Given the resources of Amazon, AMD, and other AI competitors, NVDA’s sector dominance will slowly decline as well as its margins, earnings growth rate, and price-earnings multiple.
The Big Picture:
Stocks are near historic high valuations, driven largely due to the massive fiscal stimulus and monetary accommodation to combat and economic debacle due to the COVID-19 economic collapse. Furthermore, interest rates have declined four decades, since 1981and this environment of declining interest rates has been a persistent driver of valuations in equities, bonds and real estate. The market is now on the back end of the massive monetary and fiscal tailwinds and equity market valuations are near historically high levels. With the likely deceleration in earnings led by Nvidia and the AI bubble, markets may encounter a multiple collapse over the coming days, weeks, and months.
Below are three broad market valuation models -The Buffett Indicators, The Shiller CAPE model, and the Federal Reserve Risk Premium model.
The Buffett Indicator below compares the Market Capitalization of the Russell 5000 to the US Gross Domestic Product. The Buffett model says we are two standard deviations above the historic average ratio.
Chart of Buffett Indicator (www.currentmarketvaluations.com)
The Shiller Cyclically Adjusted Price Earnings ratio model below shows the CAPE currently of 35 is at the high end of historic valuation ranges above the 1929 peak but below the 2000 tech bubble peak and 2020 pre-COVID Peak. A 35 price-earnings multiple is high.
Shiller CAPE chart (yale.edu)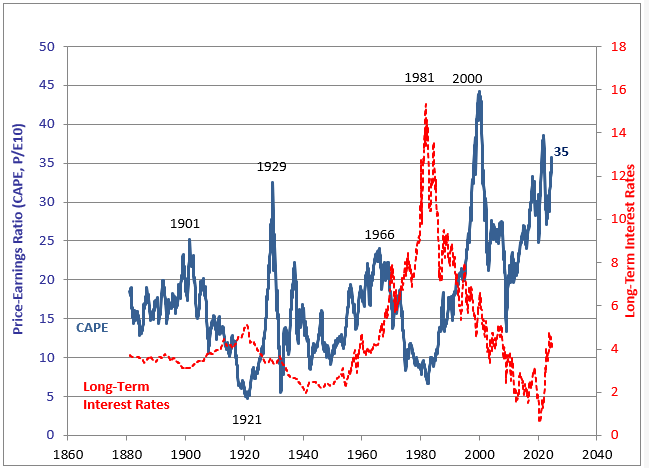
The Fed Model shown below shows the S&P 500 is in sell territory with a reading of 0.78%. If earnings decline would likely occur with an economic recession, it would move the current risk premium into negative numbers not seen since the 2000 Technology Bubble. While markets are likely excited about the prospect of the Federal Reserve easing the Fed Fund rate at its September meeting, we believe the recent improvement in inflation readings may be more the result of economic slack rather than greater supply. Consequently, while Jerome Powell’s recent tilt to an accommodating posture may sound great, it is possible that the economy may be slowing and on its way toward a recession. This could hurt earnings for the S&P 500 and lead to a 30% decline in the leading benchmark index.
Fed Model (Portfolio123.com)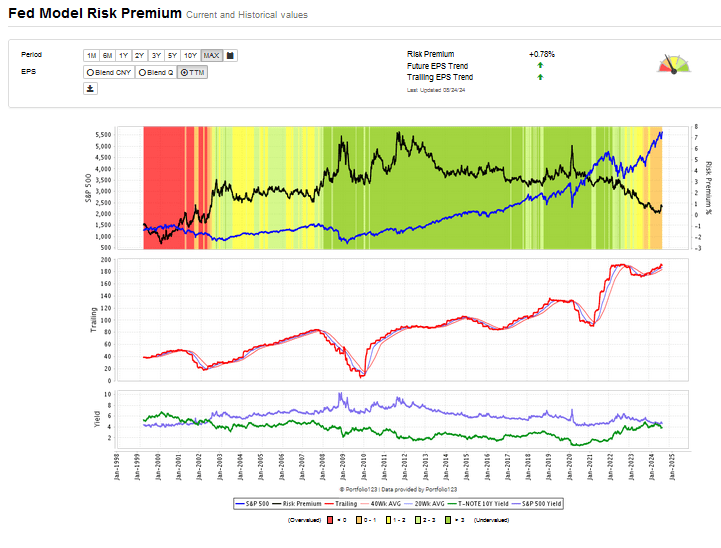
Conclusion:
The equity market is at historically high valuation levels. The recent earnings strength of large-capitalization technology stocks like the Magnificent Seven has led to breathtaking appreciation which is consistent with a market peak or Irrational Exuberance which marks a mania that frequently precedes a market collapse. No stock better represents the spirit of the irrational exuberance surrounding artificial intelligence than Nvidia.
Nvidia shares are up 11 folds in 21 months, but Nvidia shares now appear to be at a tipping point where its earnings momentum is likely to slow when it reports earnings this Wednesday, August 28th.
The purpose of this note is to highlight the high probability of an earnings deceleration at Nvidia in the coming months. With that earnings deceleration, a multiple contraction will lead to a price decline in Nvidia’s shares in the coming days, weeks, and quarters.
Regrettably, people’s perceptions are captive to human errors like recency bias. While artificial intelligence is the buzzword of the day in the business world, AI exuberance is likely to leave investors ill-prepared for the inevitable price decline in Nvidia’s shares. Investors’ perspectives are deluded into believing Nvidia’s recent rapid growth is normal, when, in fact, its inevitable earnings deceleration will bring a multiple collapse in the quarters ahead.
When earnings are reported for Nvidia this week, we anticipate an earnings growth deceleration despite earnings exceeding estimates and improved forward guidance. Market history has shown that a multiple collapse will impact Nvidia shares more than its earnings growth, and NVDA shares will begin to decline. As Nvidia declines, other AI beneficiaries will also begin to decline from their parabolic ascents in the days, weeks, and quarters ahead. A decline in the mega-cap tech stocks will weigh on the capitalization-weighted NASDAQ 100 and S&P 500 index. A reversal in the positive feedback loop which has elevated these Magnificent 7 stocks and Mega Cap stocks will soon reverse and selling will beget selling.
The S&P 500 could be at real risk if, as the economy slows, the economy slips into recession and S&P 500 earnings start to decline. Typically, when there is a recession, the S&P 500 declines 30% according to our friends at Macro Intelligence 2.
We would not be surprised at all if Nvidia’s numbers start to unwind the company’s massive run-up. Furthermore, the excitement and exceptional growth rates experienced by the Magnificent 7 stocks, Mega Cap Growth, NASDAQ 100 and S&P 500 also experience earnings deceleration in the coming quarters and concomitant share price weakness. For these reasons, we continue to advise selling Nvidia shares and reducing exposure to parabolic equities and allocating to undervalued precious metals stocks, other undervalued equity sectors and cash.
