


BING-JHEN HONG
The S&P 500 and Nasdaq 100 are taking a breath as caution seems to be the name of the game ahead of Nvidia (NVDA) earnings and US PCE data.
The S&P and the Nasdaq opened lower before rallying post US open to trade 0.65% and 0.32% up respectively. Nvidia is in focus this week, with the stock recovering following the US open to trade up around 1.65% at the time of writing.
Nasdaq 100 Early Session Heatmap
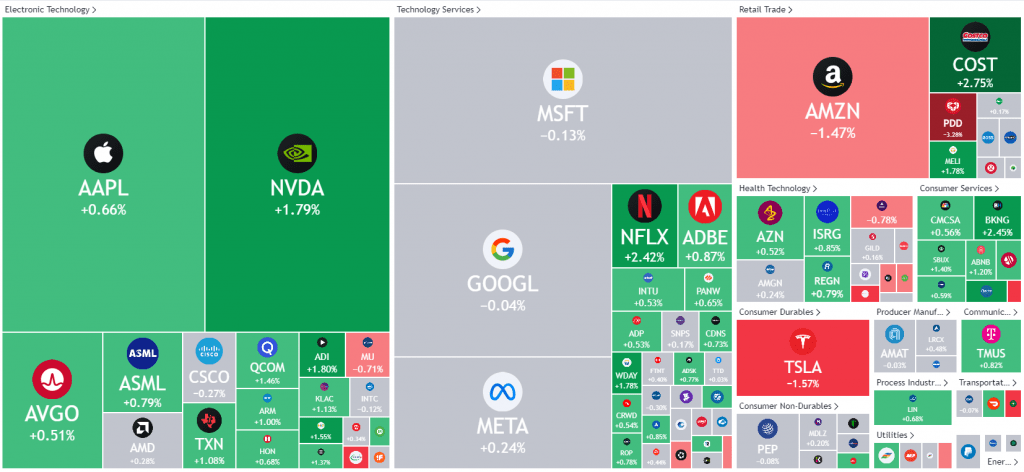
Source: LSEG
It is shaping up to be a very interesting week for Technology stocks as the Nvidia earnings could have a knock-on effect for all companies involved in the AI race. This week could prove critical for stocks in general and set the tone for the next two months in the lead up to the US election.
Looking at historical data in US election years, markets tend to dip between September and October in the lead up to the election. This is then followed by a recovery after the election heading into December and the “Santa” rally.
Looking at individual company news, Apple (AAPL) has been maintained at “buy” with a $255 target by Citigroup. Paramount Global (PARA) meanwhile fell around 5.8% after media veteran Edgar Bronfman Jr. withdrew from the race for the company. Tesla (TSLA) extended declines in early trade as Canada announced tariffs on all Chinese EV vehicles, which would include Tesla vehicles made in China.
A brief look at the fear and greed indicator has markets firmly in greed territory. It is important to remember that the fear and greed index is a contrarian indicator, which suggests that market participants tend to buy when “extreme fear” is present and sell during periods of “extreme greed”.
Fear and Greed Index
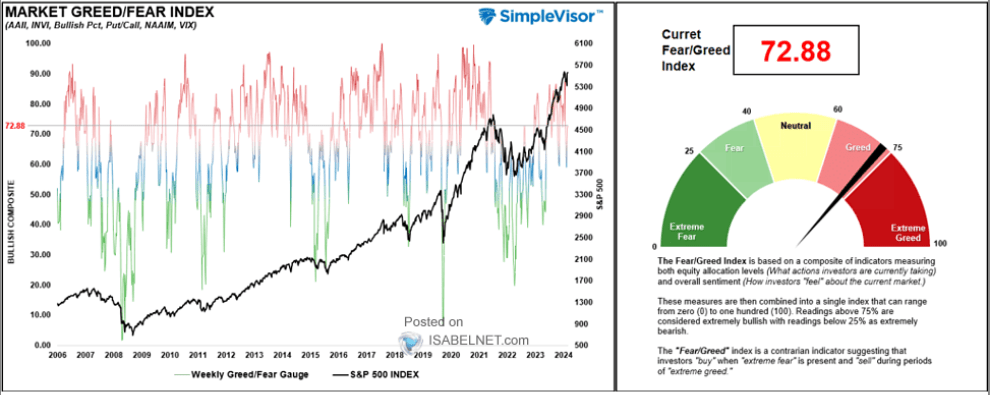
Source: LSEG
Technical Analysis Nasdaq 100
From a technical perspective, the S&P is at an intriguing level, trading just shy of the all-time highs around 5669.
Will Nvidia be the catalyst needed for fresh highs to be printed? I am cautious about this, solely based on history and what the S&P 500 tends to do during the months of September and October during election years.
The S&P has been trading in a tight range over the last 3-5 trading days with immediate support at 5560. A break below this area brings the 5500 level into focus.
A push beyond the all-time high around 5669 opens up a lot of uncertainty as the lack of historical price action to look at. I would be looking at whole numbers for potential areas to pay attention to. 5700 and 5750 would be the most immediate levels of interest.
S&P 500 Daily Chart, August 27, 2024
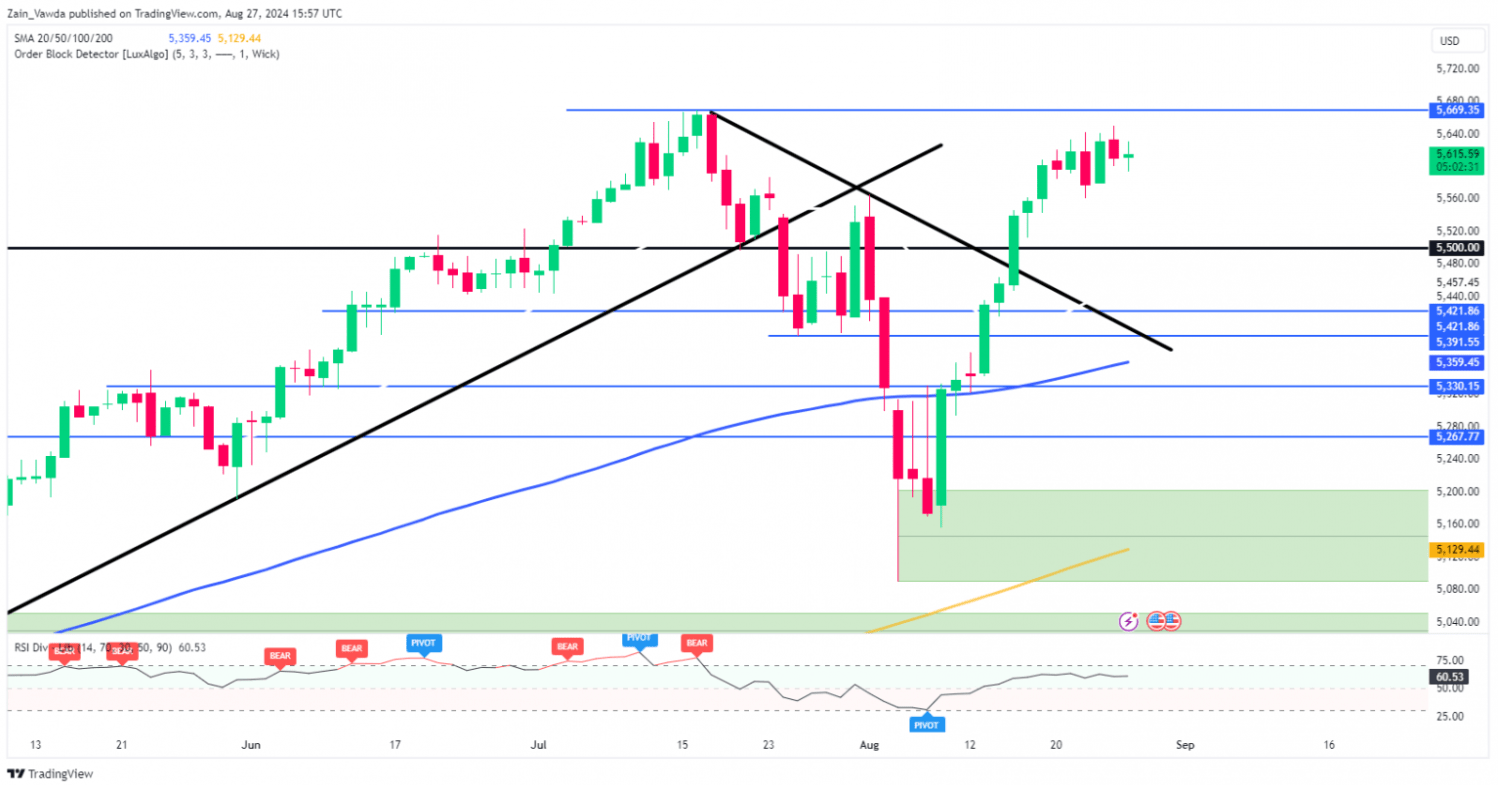
Source: TradingView
Support
Resistance
