


honglouwawa
By Zain Vawda
The S&P 500 (SP500)(SPX) and Nasdaq 100 (NDX) roared back to life on Thursday after a slight blip as Nvidia’s forward guidance pointed to a slowdown in growth in 2025. Nvidia (NVDA) smashed its Q2 earnings estimates yesterday and announced a share buyback and yet markets appeared to be paying largely unfazed.
Source: LSEG Workspace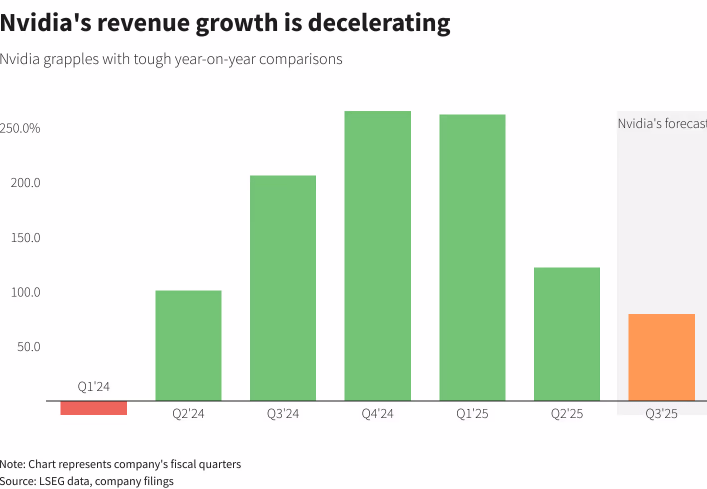
Nvidia’s forward guidance underwhelmed, with many market participants looking for a better forecast. At the time of writing, Nvidia was down around 2.97%. Wall Street banks all raised their price target on Nvidia. Bank of America (BAC) and Wells Fargo (WFC) both with a price target of $165.
Despite the uncertainty, other semiconductor stocks have enjoyed a positive day, with Broadcom (AVGO) up around 1.7%.
S&P 500 Early Session Heatmap
Source: TradingView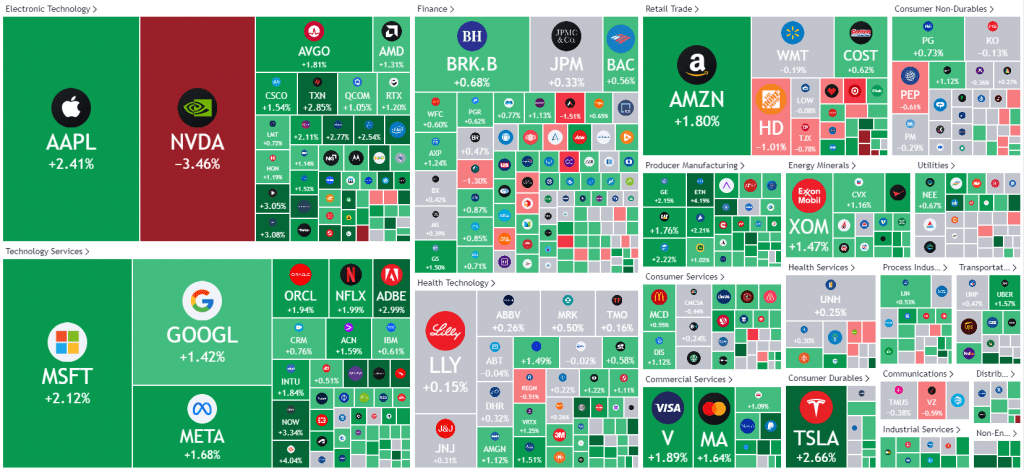
Quick Recap of Earnings Season
This earnings season has seen a market dip and some less-than-stellar results, but the main takeaway is positive. Earnings are growing faster than they have in years, and they’re expected to pick up even more speed in the fourth quarter and into 2025. While there’s more volatility and uncertainty, businesses are slowly getting back to normal, and the market seems set to overcome its current worries. The biggest uncertainty lying ahead in Q4 is undoubtedly the US election and the continued threats of wider geopolitical conflict, both of which could have a negative impact on consumers.
Technical Analysis
S&P 500
From a technical perspective, the S&P is eyeing fresh ATH as the index approaches the current all-time highs (ATH) at 5669. Following a few days of consolidative price action, the S&P is on course for a bullish engulfing daily candle close off a key area of support.
Immediate support rests at 5538 and of course the psychological 5500.
A break above the current ATH at 5669 makes it a bit more challenging to find key levels. I will focus on the whole numbers initially, such as the 5700 level for some resistance.
S&P 500 Daily Chart, August 29, 2024
Source: TradingView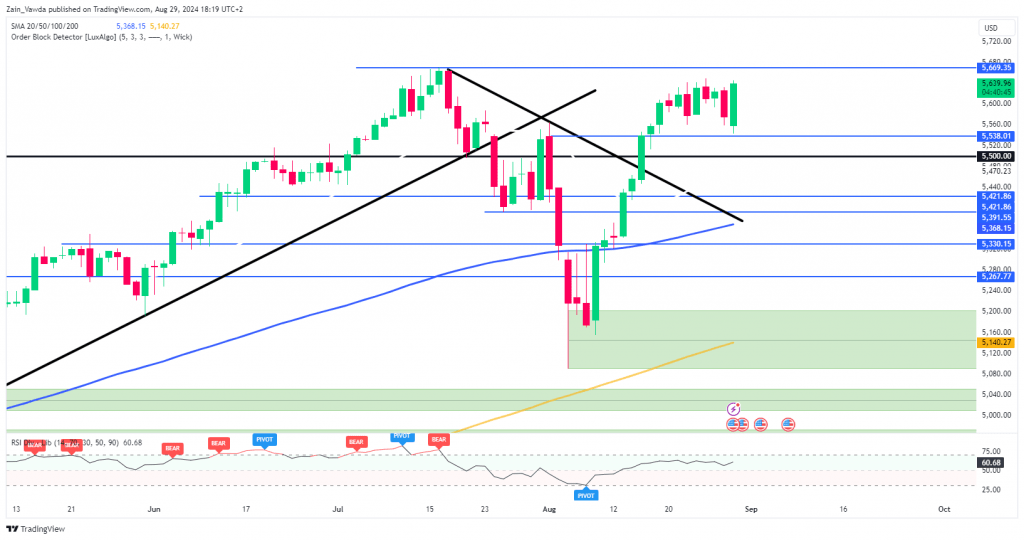
Support
Resistance
Nasdaq 100
From a technical perspective, the Nasdaq 100 on a daily timeframe changed structure with a daily close above the 19474 swing high on August 16. This was followed by an attempt to test the 20000 psychological level, which failed to materialize as the index reached a high of 19951.
This was followed by a pullback which also stopped just short of the 100-day MA, resting just below the 19000 handle. Similar to the S&P, a bullish engulfing daily candle close appears on the cards, which makes a break of the 20000 handle look more appealing.
A break above the 20000 handle will find some resistance at the 20484 swing high from July 15 before the all-time highs around 20790 comes into focus.
Conversely, a failure to push on from here will first need to navigate its way past the confluence area around 19000 before the 18416 support area comes into focus.
Nasdaq 100 Daily Chart, August 29, 2024
Source: TradingView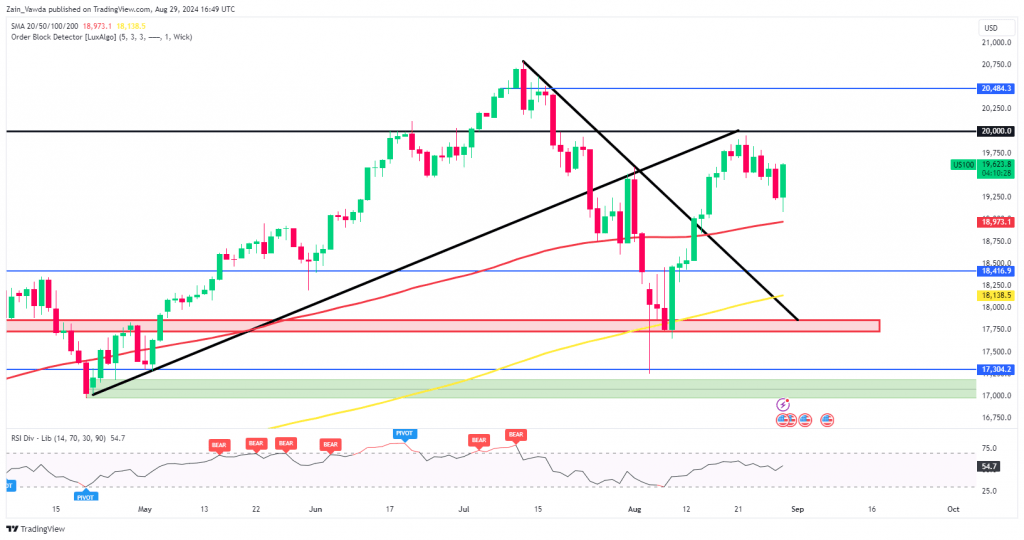
Support
Resistance
