
SlavkoSereda/iStock via Getty Images
The 1-Minute Market Report August 31, 2024
In this brief market report, we look at the various asset classes, sectors, equity categories, exchange-traded funds (ETFs), and stocks that moved the market higher and the market segments that defied the trend by moving lower.
Identifying the pockets of strength and weakness allows us to see the direction of significant money flows and their origin.
The rebound continues
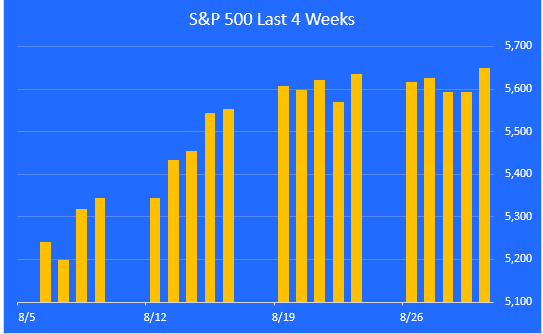
The S&P 500 took a serious hit at the start of August but has since rebounded nicely. The proximate cause for the selloff was the weak jobs report which rekindled fears of recession. The last three weeks have been positive, bringing us back to within 0.3% of the all-time high. Here’s a look at the last 4 weeks.
ZenInvestor.org
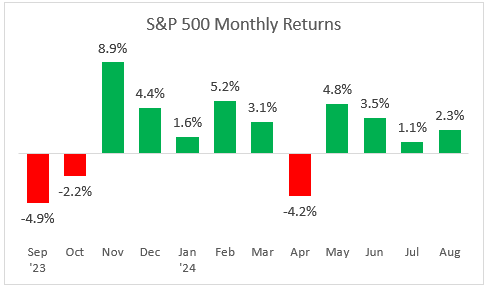
A look at monthly returns.
This chart shows the monthly returns for the past year. August got off to a shaky start but has finished solidly in the green. Bear in mind that pullbacks of 5% or so are common during bull markets.
ZenInvestor.org
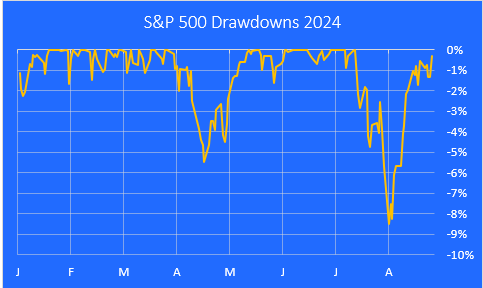
A look at the July-August selloff.
Here is a closer look at the July-August decline, using a drawdown chart. The maximum drawdown so far was 8.5% from the peak on July 16.
ZenInvestor.org
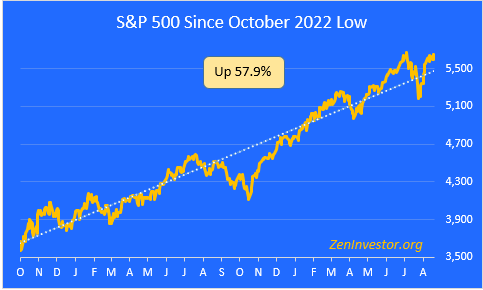
A look at the bull run since it began last October
This chart highlights the 57.9% gain in the S&P 500 from the October 2022 low through Friday’s close. We dipped below the trendline briefly, and it looks like we may be headed for another record high this week.
ZenInvestor.org
Major asset class performance.
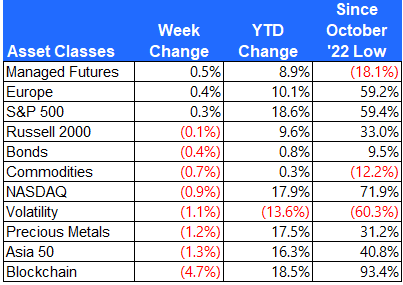
Here is a look at the performance of the major asset classes, sorted by last week’s returns. I also included the returns since the October 12, 2022 low for additional context.
The best performer last week was the Managed Futures. The worst performer was Blockchain. Bitcoin topped out at $71,000 on June 4th and has since fallen to $59,000.
ZenInvestor.org
Equity sector performance
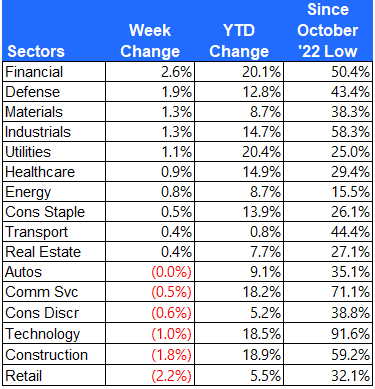
For this report, I use the expanded sectors as published by Zacks. They use 16 sectors rather than the standard 11. This gives us added granularity as we survey the winners and losers.
Financial stocks had a good week. Defense stocks outperformed after tensions mounted in the Middle East. Retail stocks were the worst performing sector.
ZenInvestor.org
Equity group performance
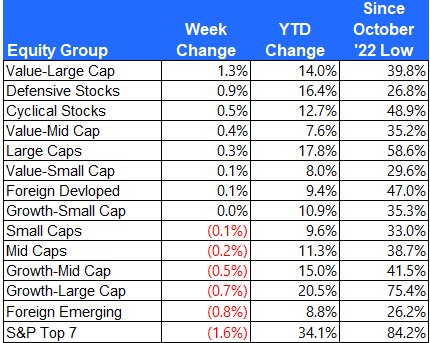
For the groups, I separate the stocks in the S&P 1500 Composite Index by shared characteristics like growth, value, size, cyclical, defensive, and domestic vs. foreign.
The top group was large cap value, as investors rotated away from growth names. The worst performer was the Mag 7, down 1.6%.
ZenInvestor.org
The S&P Mag 7
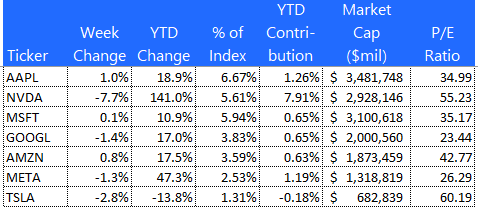
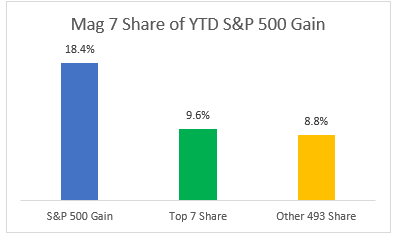
Here is a look at the seven mega-cap stocks that have been leading the market over the past year. These seven stocks account for 53% of the total YTD gain in the S&P 500. That’s down from 87% at the start of the year, providing evidence that participation in the bull market is broadening. Tesla was the big winner while Microsoft struggled.
ZenInvestor.org
The S&P Top 7 dominance is fading
ZenInvestor.org
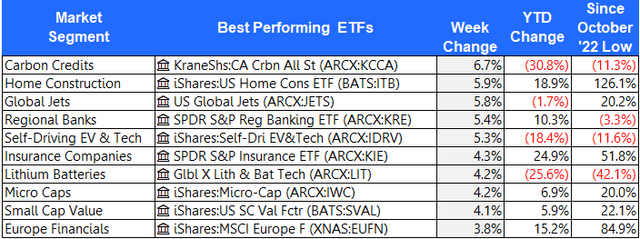
The 10 best-performing ETFs from last week
Carbon Credits and Home Construction surged higher last week.
ZenInvestor.org
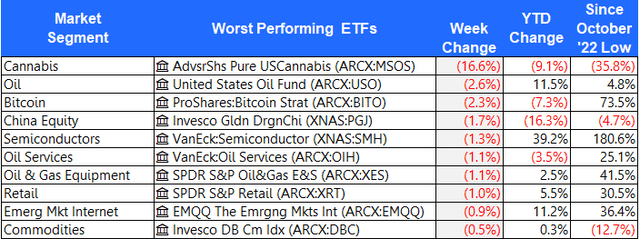
The 10 worst-performing ETFs from last week
Growers and marketers of Cannabis had another rough week. Oil prices retreated on Friday as investors weighed expectations of a rise in OPEC+ supply starting in October, alongside dwindling hopes of a hefty U.S. interest rate cut next month, following data showing strong consumer spending.
ZenInvestor.org
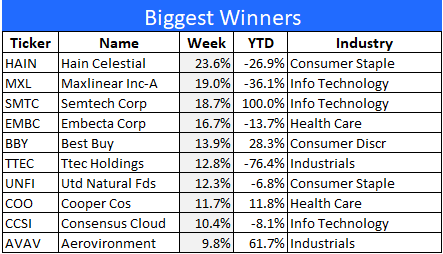
The 10 best-performing stocks from last week
Here are the 10 best-performing stocks in the S&P 1500 last week. Emergent
Shares of Hain Celestial (HAIN) were jumping Friday after the packaged-food company posted better-than-expected results in its fiscal fourth-quarter earnings report.
ZenInvestor.org
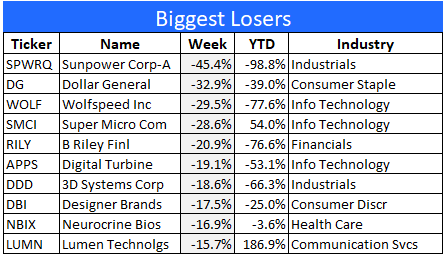
The 10 worst-performing stocks from last week
Here are the 10 worst-performing stocks in the S&P 1500 last week.
SunPower (OTC:SPWRQ) looks headed for the dust bin.
ZenInvestor.org
Final thoughts
Investors continue to trim back their exposure to large cap growth stocks like Nvidia and use those funds to buy less expensive small and mid-caps. The Great Rotation continues. Nvidia announced earnings on Wednesday after the bell, and once again beat their numbers on the top and bottom line, as well as offering higher guidance for next quarter. The stock sold off. Why? Apparently, the “whisper” numbers were even higher than Nvidia announced. This supports my view that analysts and investors are too optimistic about earnings in the AI space.
Meanwhile, the small-cap Russell 2000 index is inching higher and getting close to making a new record high. And the mid-cap S&P 400 has already made a new high. So, investors are switching from fast growth stocks to more reasonably priced smaller value plays.
The AI trade is not dead, it’s just taking a rest while investors look to diversify their holdings. With interest rates set to come down later in September, I think the rally has further room to run.


