


Dorin Puha
Investors will get a reality check this coming week following the Labor Day weekend. Stocks snapped back from a steep drop to start August, and the low-volume trading environment, which appeared to be due to an absence of sellers, allowed stocks to rally back.
One thing seems clear: the yield curve is steepening, and the dollar is weakening. Those conditions tend to be seen in an environment where the economy is weakening, and this is a significant change from the market just a year ago.
Key Economic Reports on the Horizon
The ISM manufacturing report will kick things off first thing Tuesday morning, with analysts expecting the report to show that the sector improved slightly. Analysts are estimating that the index will rise to 47.5 from 46.8 in July. Additionally, investors will be watching to see if the employment index improved during the month after falling to 43.4 in July, its lowest level since 2020. It is a level that often is associated with recession, and if it were to drop lower, it would not be a good sign for the health of the economy.
Bloomberg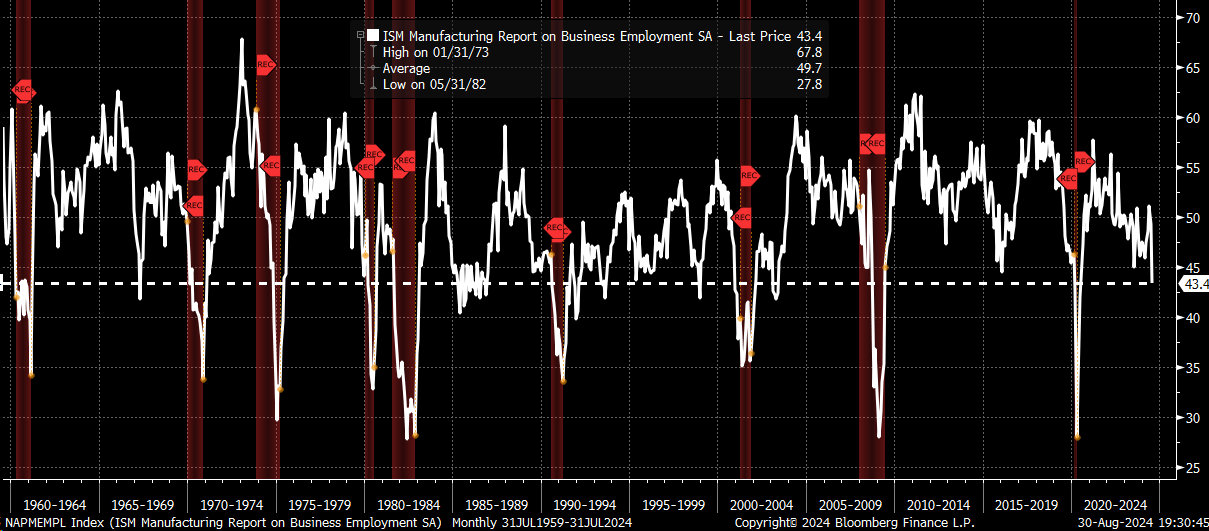
The JOLTS data will come on Wednesday, and it is expected to decline to 8.1 million from 8.2 million in July. This number is tough to predict and is subject to big revisions. But what seems clear based on Indeed job openings data and LinkUp Unique Active Job Count is that the number of open jobs continues to decline.
Bloomberg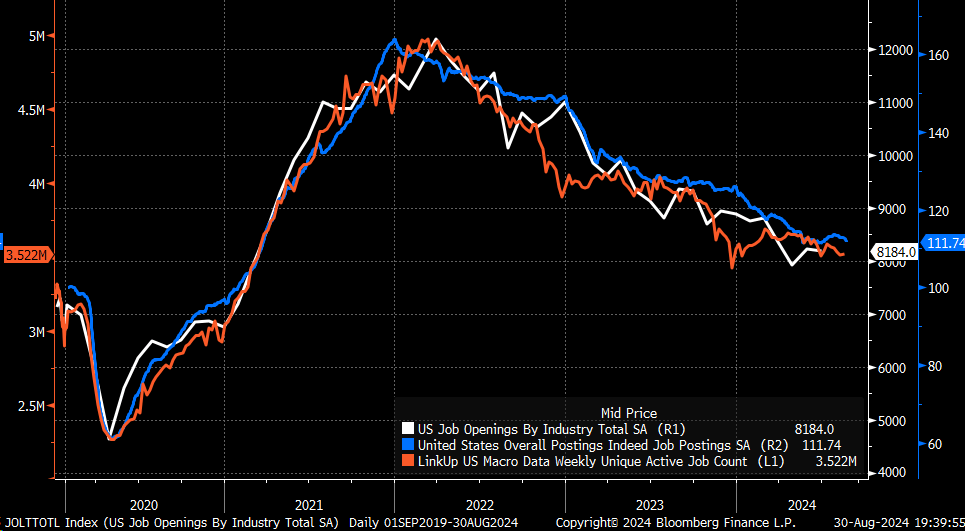
Thursday’s data will bring us the ADP employment report and the ISM services reading. Analysts expect ADP to show that 140,000 jobs were created in August, up from 122,000 in July. Meanwhile, the ISM services index is expected to fall to 51.1 from 51.4 in July. Data for the ISM services isn’t as robust as data for the manufacturing sector, but a reading of 51 or less is not typical for this sector. In December 2007, the US economy entered a recession when the ISM services sector had a reading of 52 and 50.7 in March 2001.
Bloomberg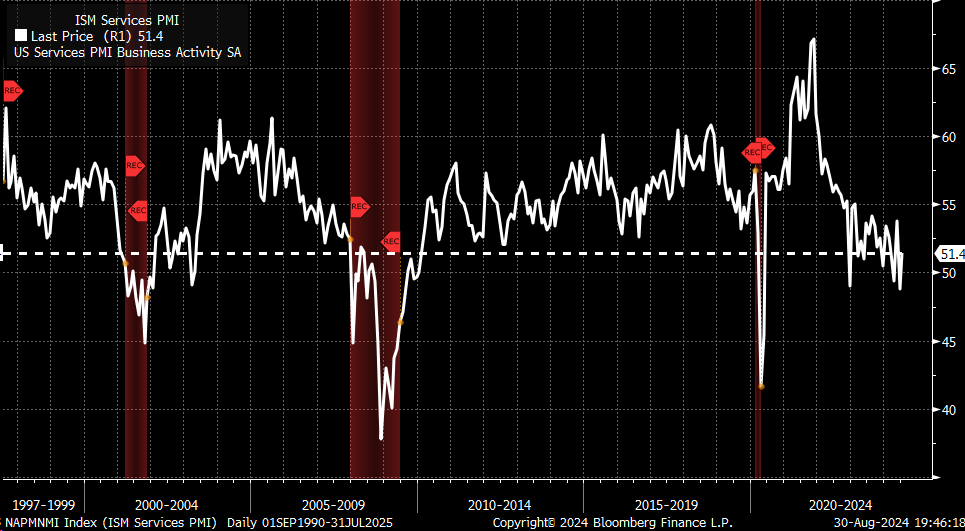
Friday’s Jobs Report
Of course, Friday will be the big day when the job report is released, and estimates are for 165,000 jobs created in August, up from 114,000 in July. Meanwhile, the unemployment rate is expected to fall to 4.2% from 4.3% in July, while average hourly wages are seen climbing by 0.3% m/m up from 0.2% and rising by 3.7% y/y up from 3.6%.
Obviously, the big focus will be on the non-farm payroll number and the unemployment rate after the shock reading in July. Unfortunately, there is some anecdotal evidence to suggest hiring may have slowed in August, and the unemployment rate may have increased. The regional Fed surveys mostly showed that employment across various regions fell again in August; the question is whether the couple of surveys that improved are able to offset the weakness.
Bloomberg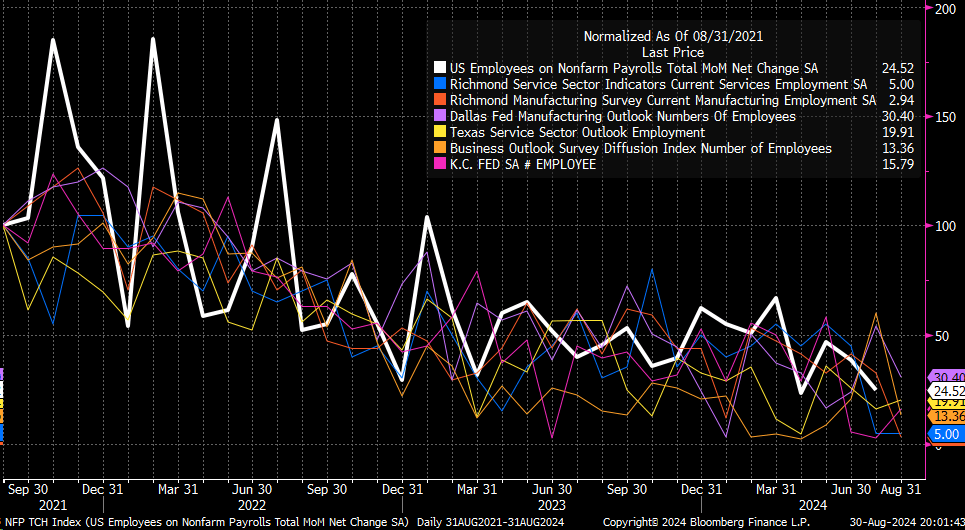
Additionally, indicators suggest the unemployment rate may not fall to 4.2% in August and may stay at 4.3% or even rise—the Conference Board Jobs Hard to Find increased in August to its highest level since July 2021. Over time, this can be a leading indicator of the unemployment rate rising.
Bloomberg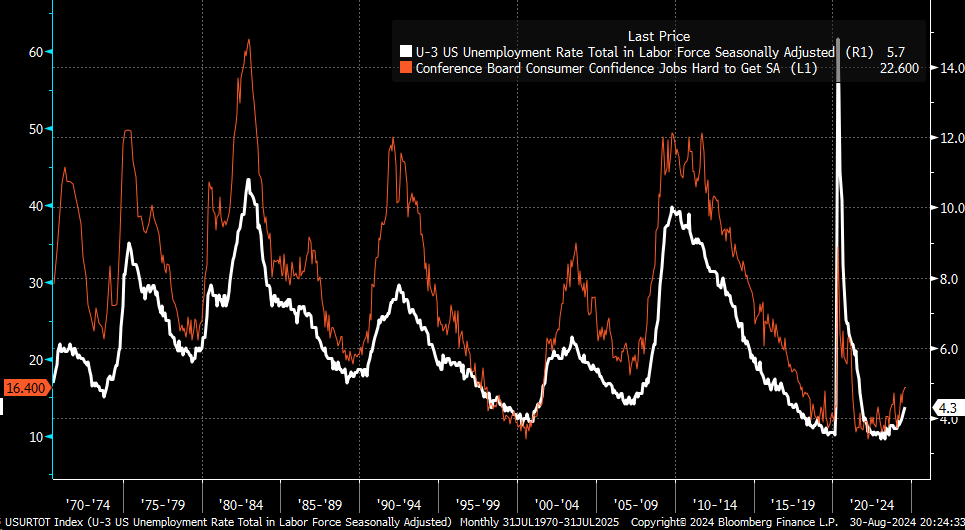
Additionally, in recent months, the NFIB survey’s ranking of poor sales as the single most important problem has surged and is back to its highest level since the pandemic. This can also be a leading indicator of a rising unemployment rate.
Bloomberg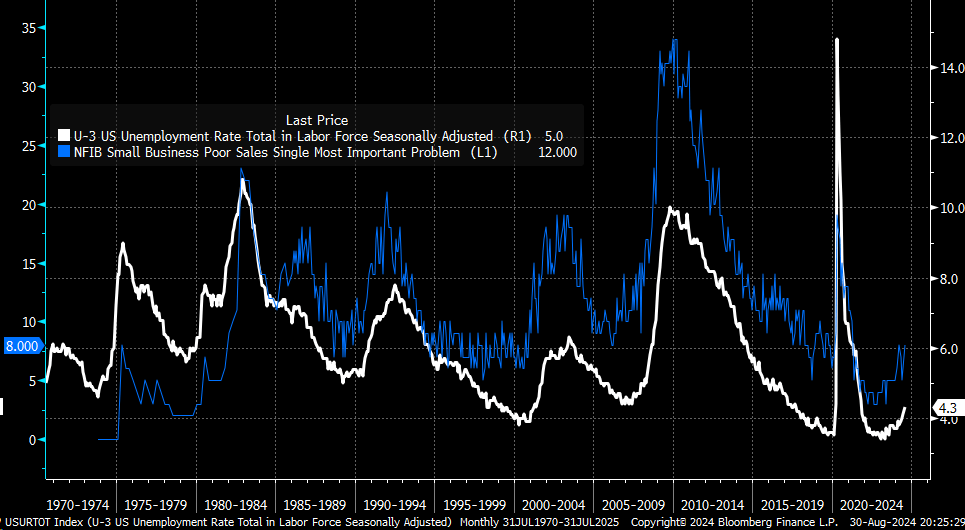
Finally, the yield curve can also be a leading indicator of unemployment. In this case, the 30-year minus the 5-year has surged to its highest level in years, and it, too, can be a leading indicator of the direction of the unemployment rate.
Bloomberg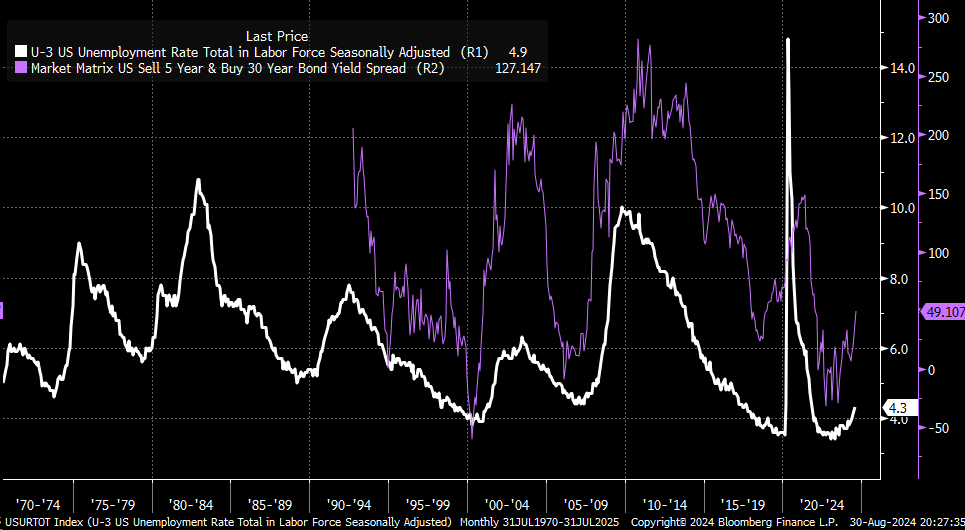
Yield Curve and Dollar Dynamics
Additionally, if the economic data comes in soft, as estimates suggest, it will only steepen the yield curve further, as the 2-year rate continues to drop relative to the 10-year rate. This will also drive the dollar lower against most major currencies.
Going back to the mid-1980s, a combination of a steepening yield and weakening Japanese yen either preceded or occurred during a US economic recession. The Japanese yen can often be seen as a safe-haven currency, and clearly, if investors are concerned about a US hard landing, it would then make sense to see the yen appreciate versus the dollar as the yield curve steepens.
It is also the currency of choice for a carry trade, and if the Fed is on the cusp of aggressively cutting rates, trade will be very quick to abandon the yen carry trade.
Bloomberg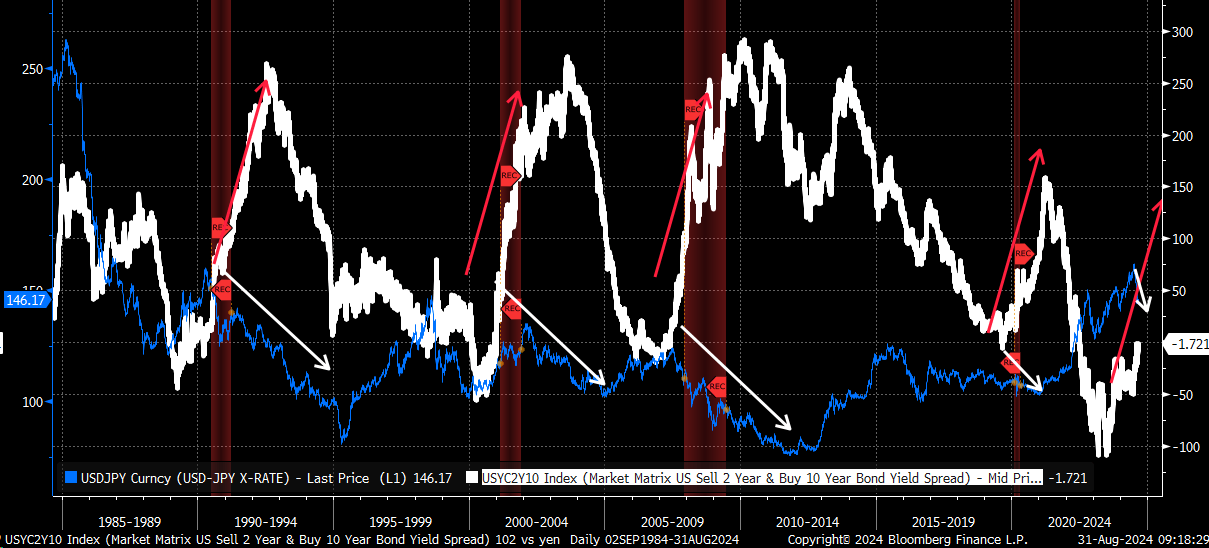
Typically, during periods of the dollar weakening and the yield curve steepening, equity values fall dramatically, with 2000 and 2008 being the more extreme cases. 1990 only saw a modest 20% decline, compared to the much larger declines of 2000 and 2008.
Bloomberg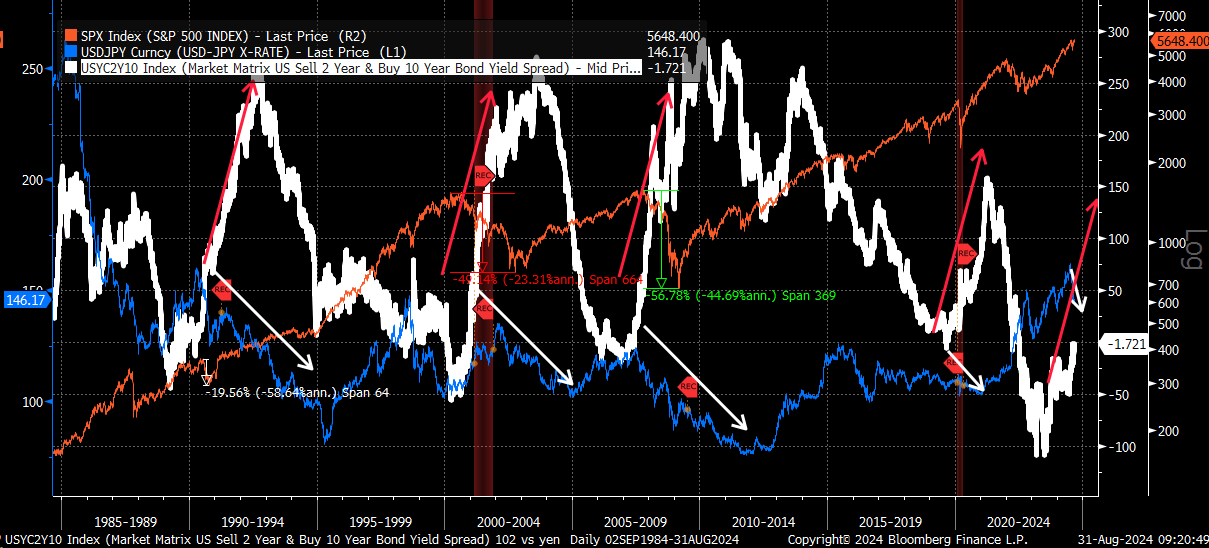
Valuations could have played a part in the decline in 1990 being more modest compared to 2000, with the blended 12-month forward in 1990 for the S&P 500 at just 12, compared to 22 in 2000 when the recession started. The 2008 decline involved more event and systematic risks, and even at that point, valuations were notably higher than in 1990 at around 16. Today’s valuation represents something much more like that seen in 2000 at currently around 21.5.
Bloomberg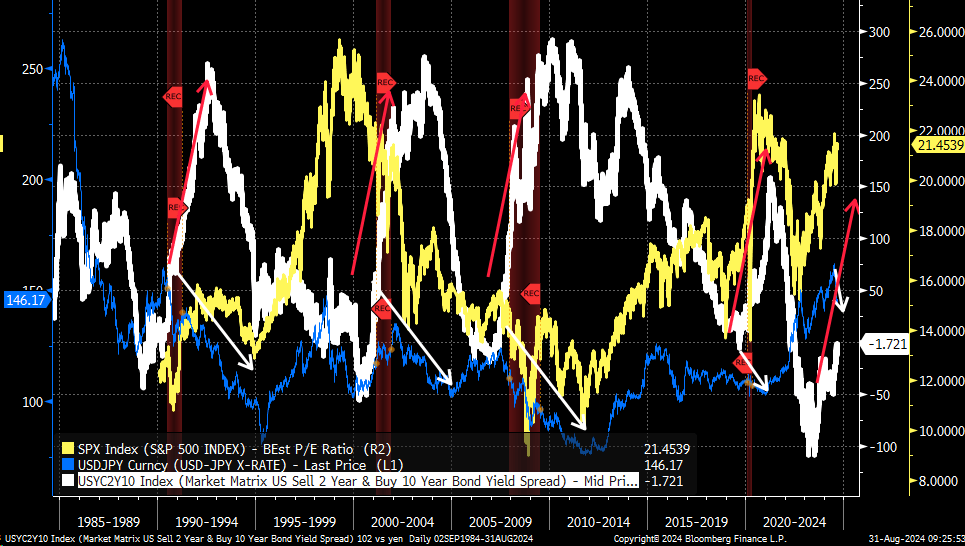
Market Volatility Ahead?
If history can be a guide here, then it would suggest that the recent strengthening of the yen is only likely to continue, and so too shall the steepening of the curve. This means that equity market volatility that started in August is only expected to continue moving forward, should the economic data warrant it.
Based on some of the data collected throughout August, it seems to suggest that the coming week’s news should warrant a continuation of a steeper curve and a weaker dollar, even if the data moves at a much slower rate than the market.
