


billnoll
When I think about the metals market, I chuckle as it has obliterated just about every expectation many have had about what drives the market.
We have seen metals decline during a strong inflationary period in 2022, wherein most were expecting it to rally alongside inflation. We have seen metals rally alongside the US dollar, when most were expecting them to move in the opposite direction to the dollar. And we have seen rallies surprise many market participants due to a “lack of clear catalyst.”
Well, anyone that has followed my work through the years should not be surprised. I have attempted time and again to outline the many fallacies propagated throughout the metals market, while also outlining the most accurate manner in which you should track the metals. To this end, those who have followed along through the years recognize the accuracy of our work.
In fact, our analysis provided for advance warning of the gold top in 2011 within $6 of the actual high struck, and outlined the downside target for the 2011-2015 correction even before we topped. Moreover, we then caught the low struck by gold at the end of 2015 as it was striking that low in the after hours.
In late 2015, as I was seeing signs that gold was bottoming, and outlined that we may come up a bit shy of the $1,000 target. And, on Dec. 30, 2015, I penned the following message to those willing to listen:
“As we move into 2016, I believe there is a greater than 80% probability that we finally see a long term bottom formed in the metals and miners and the long term bull market resumes. Those who followed our advice in 2011, and moved out of this market for the correction we expected, are now moving back into this market as we approach the long-term bottom. In 2011, before gold even topped, we set our ideal target for this correction in the $700-$1,000 region in gold. We are now reaching our ideal target region, and the pattern we have developed over the last 4 years is just about complete… For those interested in my advice, I would highly suggest you start moving back into this market with your long term money… “
For those who followed my work of late, you would know we caught the more recent pullback lows in silver and gold as well. Last year, I attempted to get readers focused on the metals, as I wrote several public articles on the metals during the last half of 2023 outlining my bullish expectations for the metals over the following year+. In fact, back in October 2023, this is what my GLD chart was projecting:
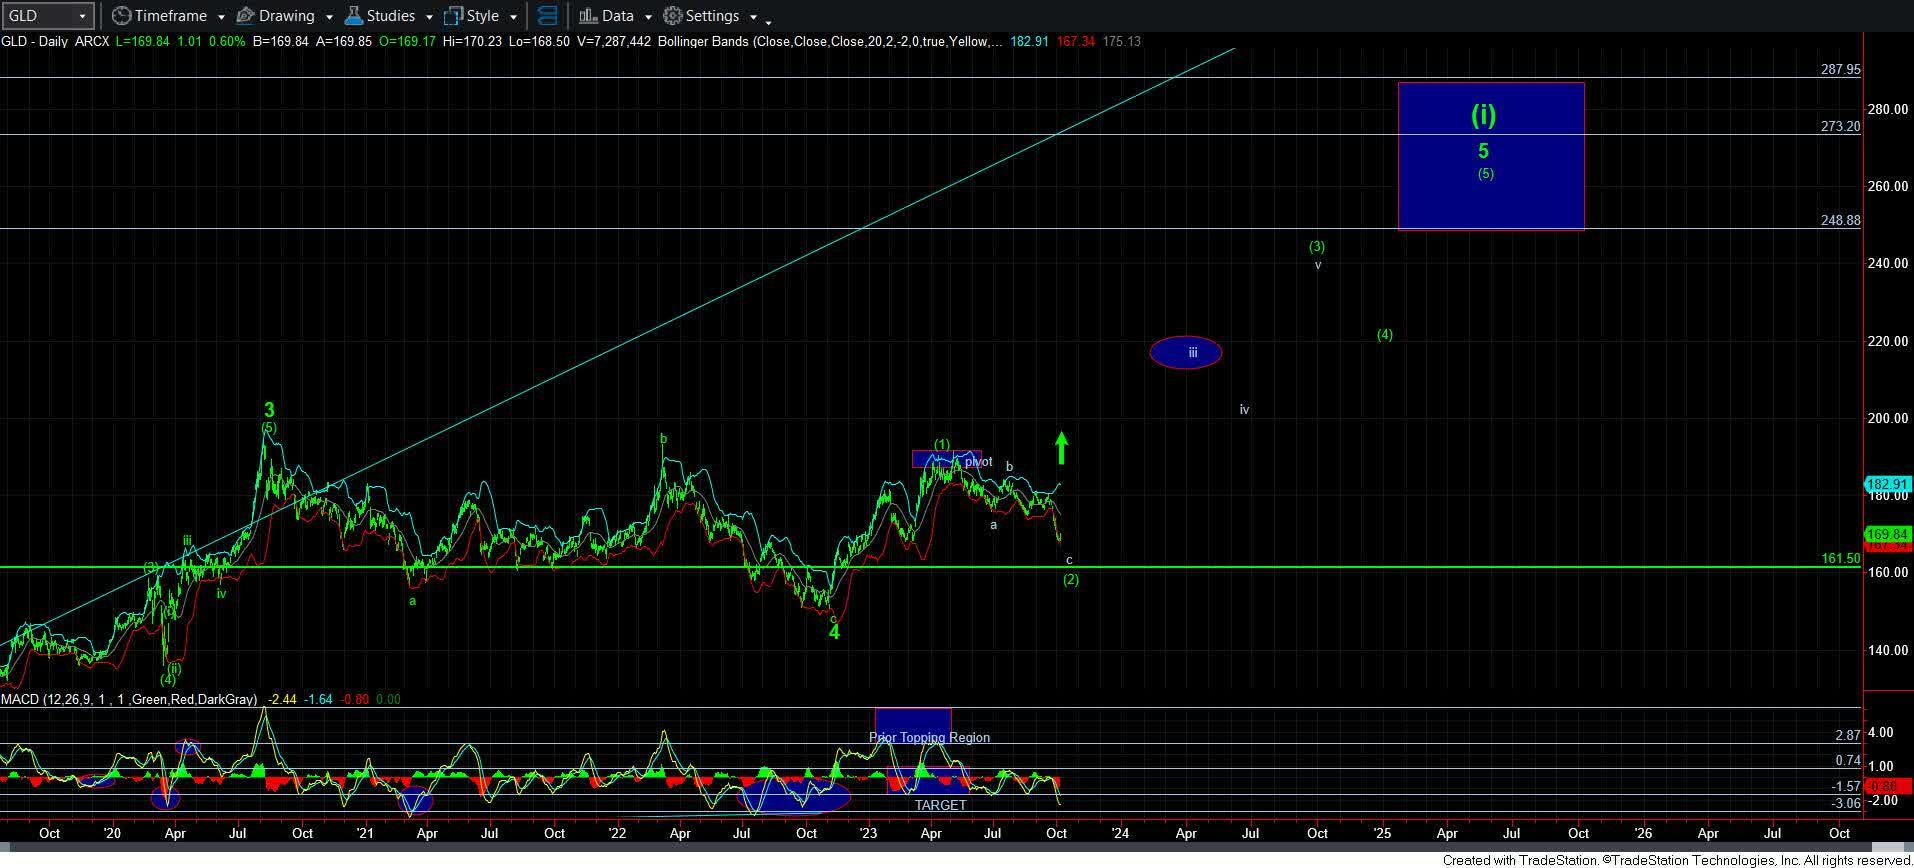
Elliottwavetrader.net
And, then in February 2024, this is what we were showing:
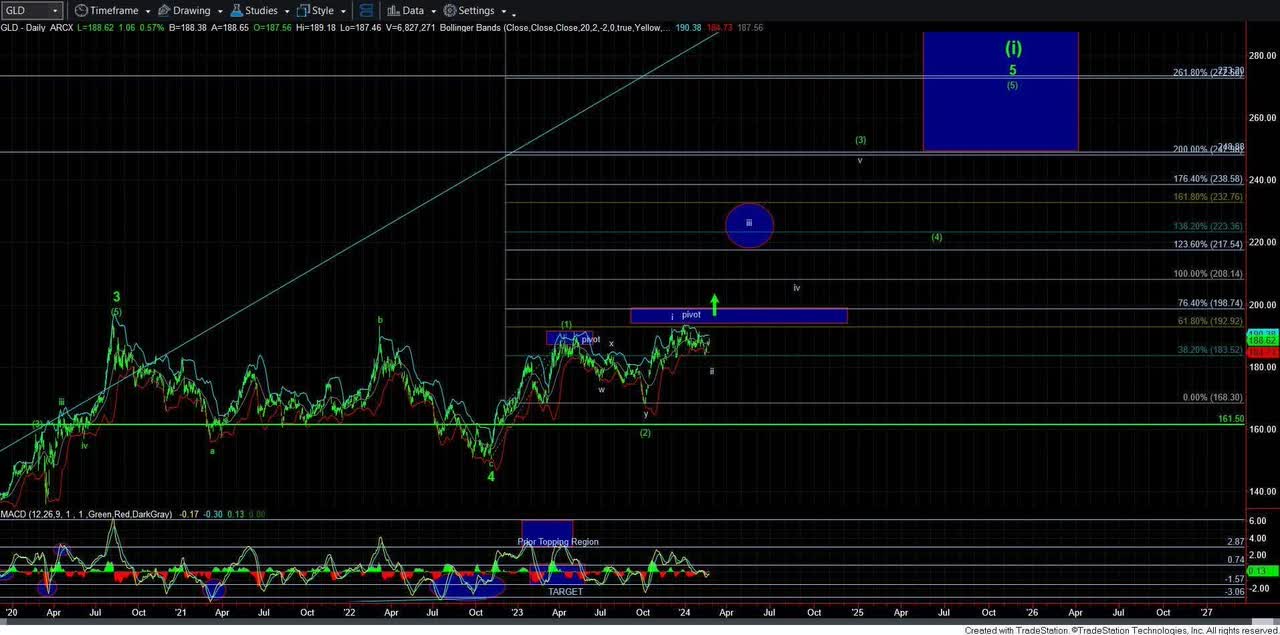
Elliottwavetrader.net
As you can see from these charts, we have hit our targets almost perfectly thus far. We have rallied to our target for wave iii, have consolidated in wave iv, as expected over half a year ago, and we seem to be trying to build momentum for wave v. In fact, wave v may actually exceed the target we set almost a year ago. Again, this underscores the accuracy you can often achieve with our Elliott Wave Fibonacci Pinball methodology.
Moreover, we have done quite well in the mining stocks too. Back in September of 2015, we identified the bottoming structure developing in the mining stocks. And, as an example, we were buying Newmont Mining (NEM), one of the largest mining companies, around $15 a share. As the market developed, I set my long-term target for the 82-85 region. And, as we were approaching the 82 region in April of 2022, I outlined to our subscribers that I was selling my shares in NEM. As we now know, the top was struck that month at 86.37, with price proceeding to drop precipitously and losing over 50% of its value within the next seven months.
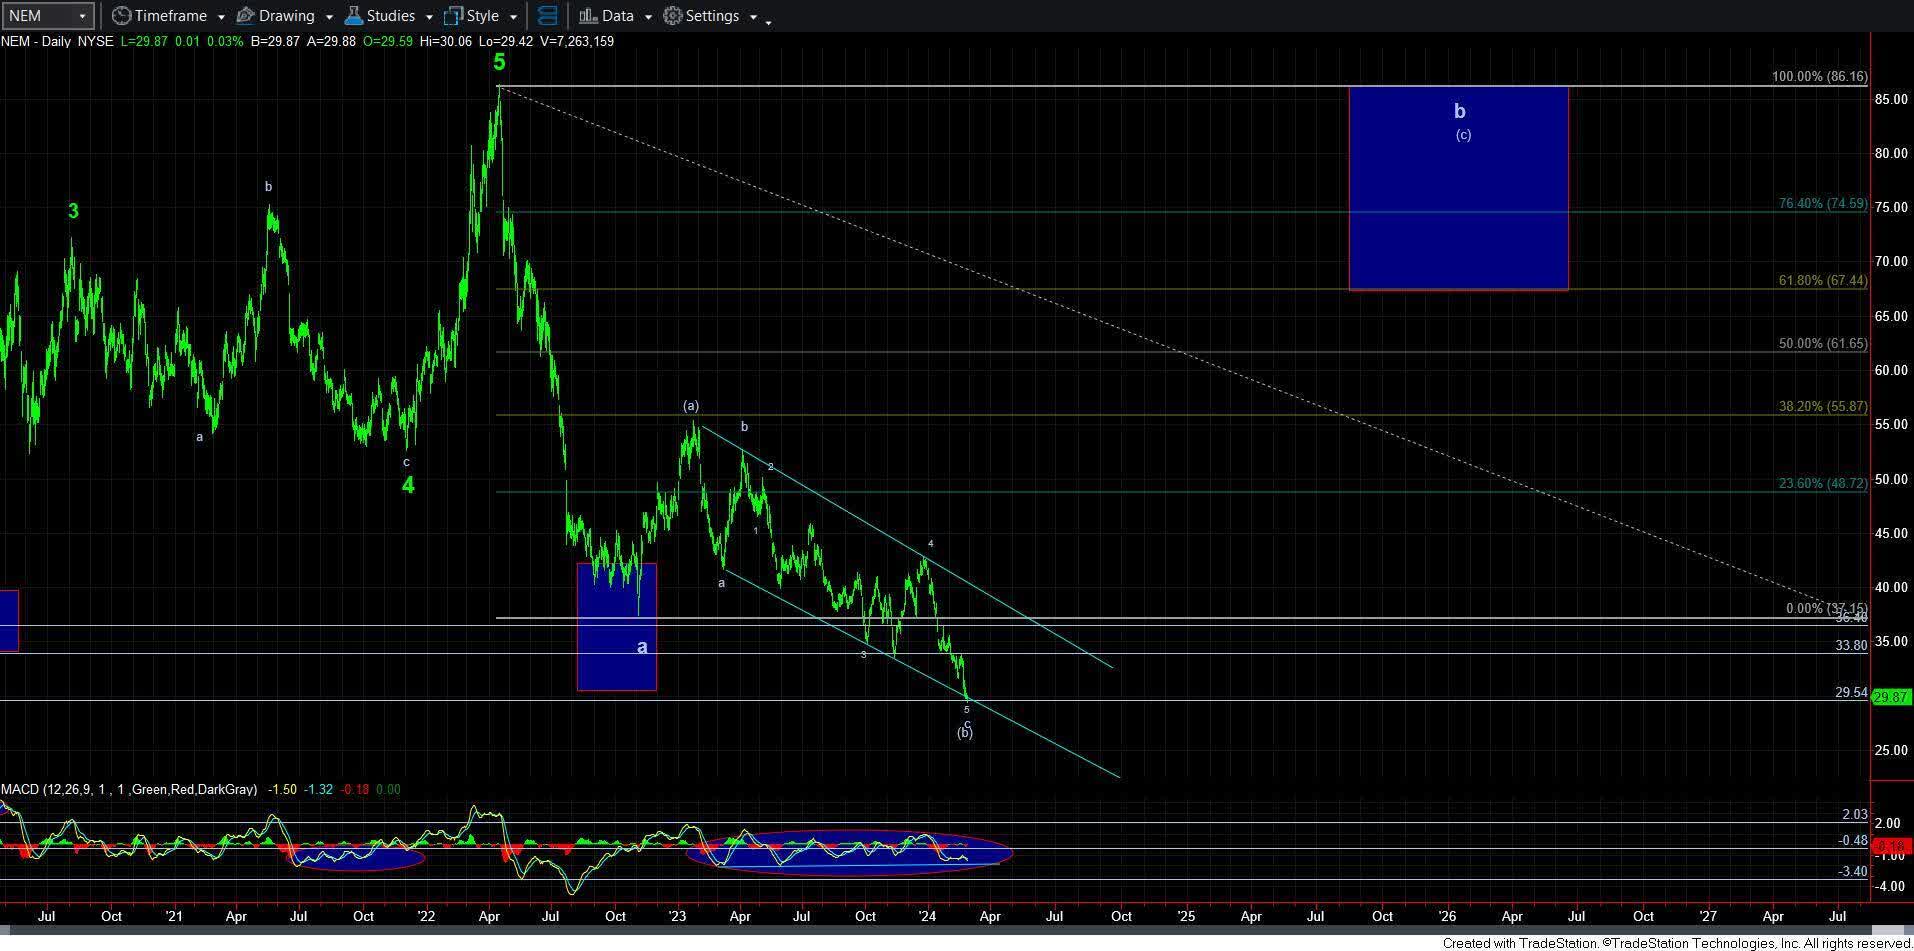
Elliottwavetrader.net
More recently, you can see our analysis here on NEM as we expected a major low to be struck, followed by a strong rally, which I believe still has a lot higher to run. As of now, we have rallied more than 80% off the February low. Moreover, I’m targeting the upper end of my target box over the coming 18 months or so.
So, now, I’m going to give you a heads up on silver. Based upon the current set-up I’m seeing in silver, support is now in the 28/29 region. As long as that holds as support, this set-up is projecting us to an ideal target between the 36.50-40 region in a very strong and relatively fast rally. This set up will trigger by a strong move through 32.
As an aside, if silver is unable to bust through the 32 region on the next rally, then it means that we will likely see one more corrective pullback before the strong rally to 36-40, and ultimately higher. As an alternative, should silver see a sustained break below 27.50, then it will make this pullback likely much deeper, and point down into the 24.35-26 region before that next rally takes hold.
Silver has significantly lagged during the gold rally. And I cannot say that it‘s unusual to see the various metals charts at different degrees in their structures. If you may remember, silver topped in April of 2011, whereas gold continued to rally on until it struck its top five months later in September. So, I think silver is now going to make an attempt to catch up. And, when silver runs, boy does it run. In fact, a parabolic move such as the one seen in 2010-2011 is not out of the question. But we’re going to take this one step at a time.
Housekeeping Matters
Note: This article was originally published on Aug. 30.
If you would like notifications as to when my new articles are published, please hit the button at the bottom of the page to “Follow” me.
For those who are questioning why all comments (including mine) go through moderation, you can read here: Haters Are Gonna Hate – Until They Learn.
