


Adam Gault
It’s now pretty much certain that the Federal Reserve will slash interest rates by September. At Jackson Hole on Friday, 23 August, Powell stated the following:
- “My confidence has grown that inflation is on a sustainable path back to 2%”
- “The time has come for policy to adjust. The direction of travel is clear, and the timing and pace of rate cuts will depend on incoming data, the evolving outlook, and the balance of risk”
- “It seems unlikely that the labor market will be a source of elevated inflationary pressures anytime soon. We do not seek or welcome further cooling in labor market conditions.”
Markets responded quite favorably. Risk assets shot higher and the SP500 inched closer to the previous ATH as Friday trading came to a close. Bitcoin (BTC-USD) continued moving higher after traditional markets had closed for the weekend.
With that being said, I think the following are the most important graphics to see right now. The first is the AAII sentiment survey. Current bullish sentiment is very close to the 1-year bullish high. This tends to be a great contrarian indicator. Overt bullishness like what we are currently seeing is, in fact, bearish.
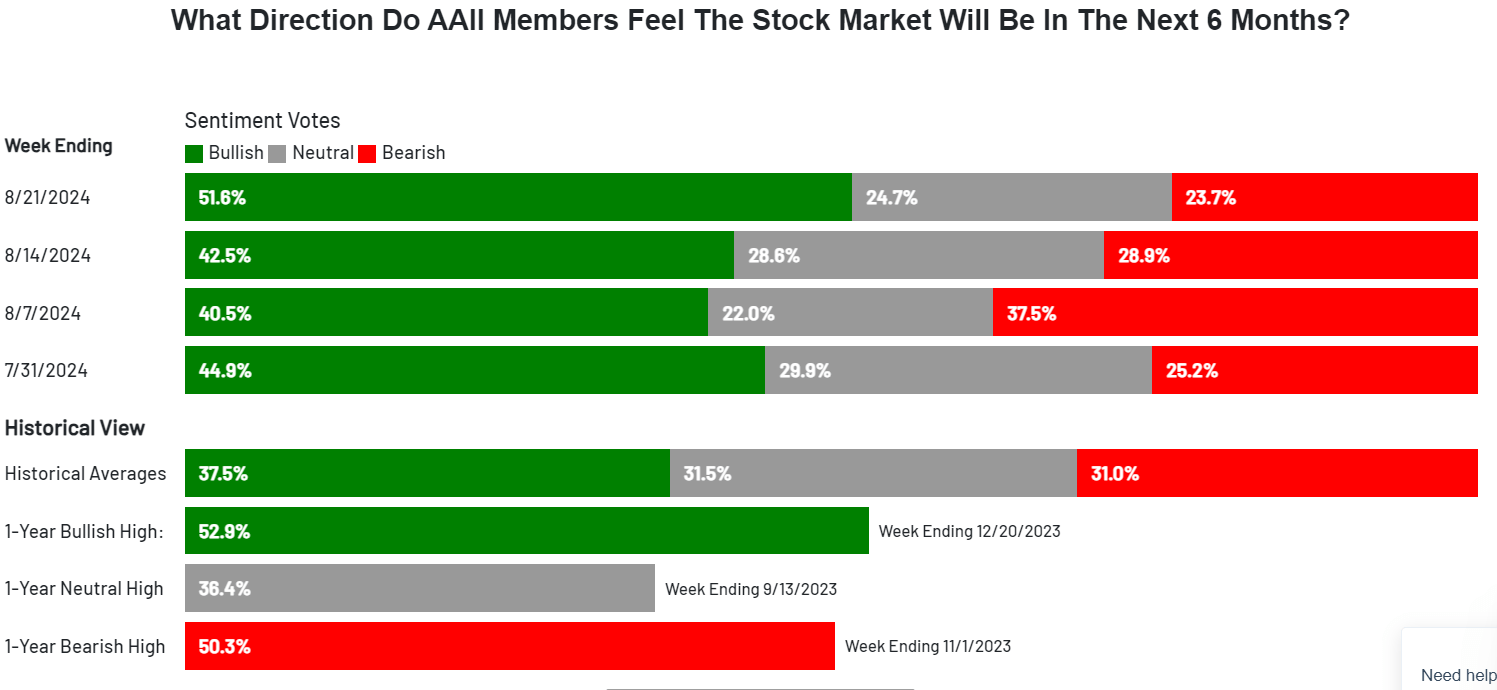
Sentiment Survey (AAII)
The second graphic is more serious. This is the Fed Funds Rate, plotted with recessions shaded in. The observation is obvious: rate cuts tend to immediately precede the recession. Rate cuts are, in fact, bearish, at least from the perspective of looking forward into the next 6–12 months.
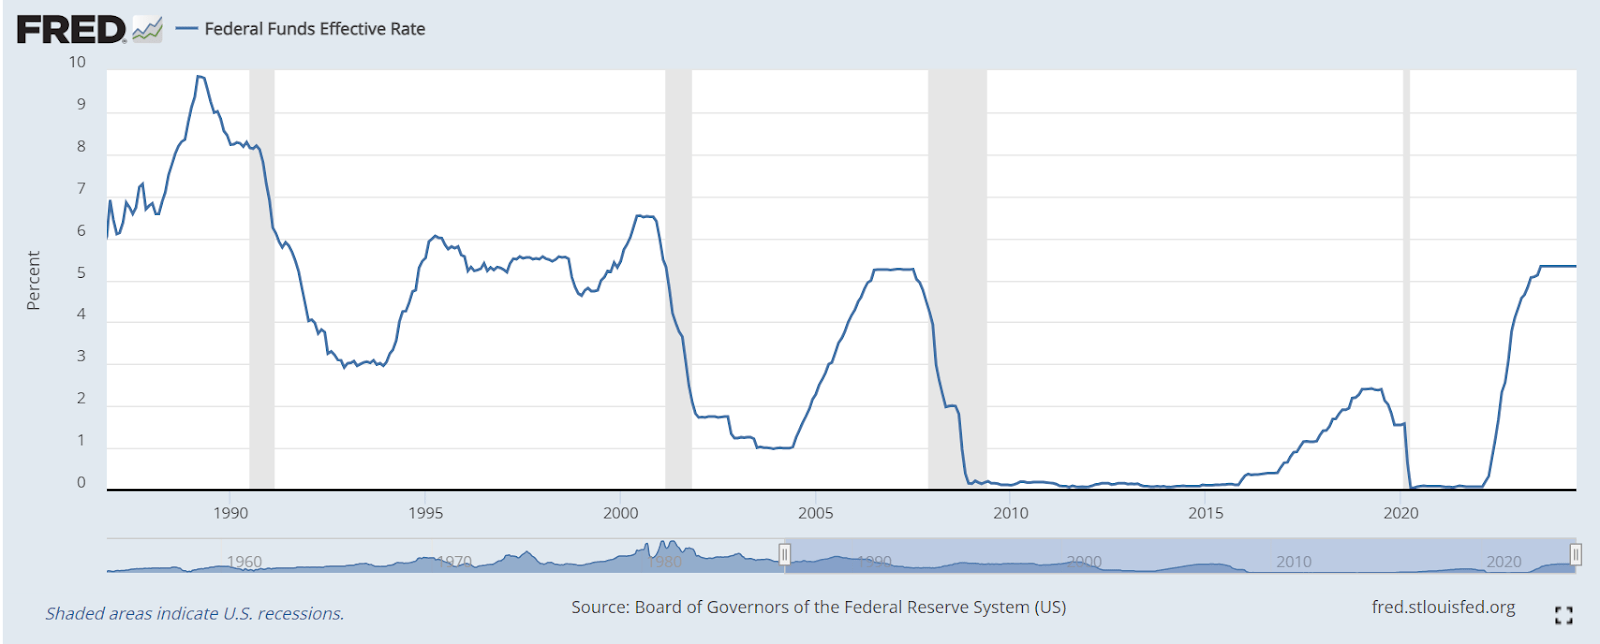
Fed Funds Rate (FRED)
The third graphic is similar. It is the yield curve, measured by the spread between the 2yr treasury bond and 10yr treasury bond. It is well known that inversions predict recessions, but the recessions take off after the 2-10 spread goes above 0. Currently, we are very close to 0.
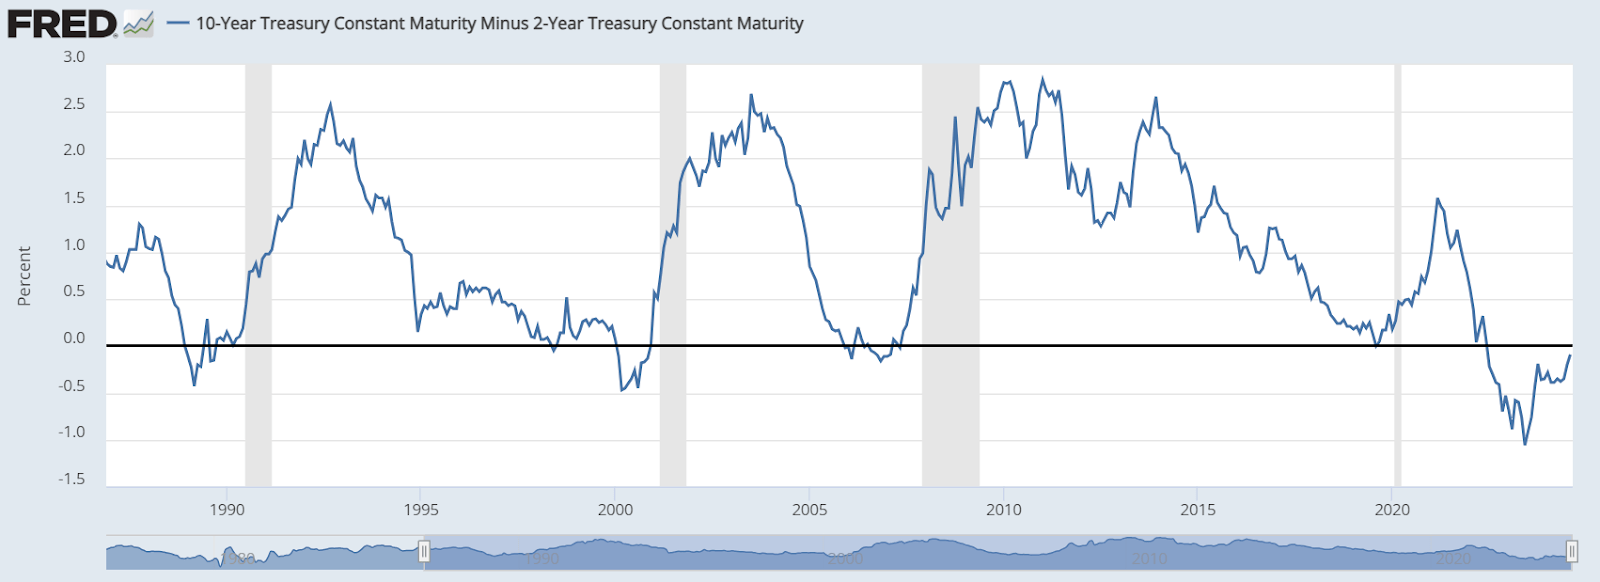
2-10 CMS (FRED)
And just in case you were wondering if these shaded regions meant that stocks actually went down, please look at this chart of the Nasdaq Composite with the same shaded regions as the last two charts. The SP500 and Dow Jones charts on FRED only go back to ~2010, so I used the Nasdaq Composite as a substitute for a broad stock index.
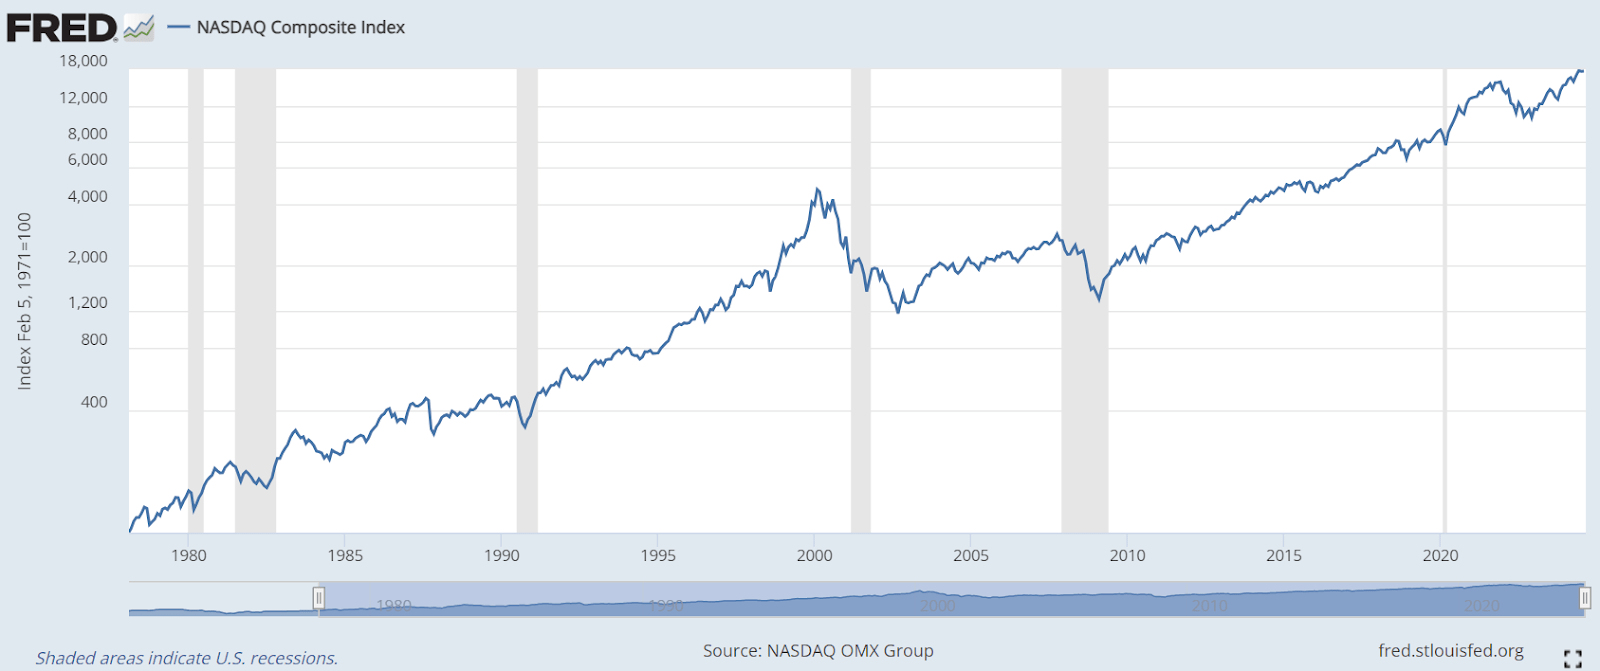
Nasdaq Composite (FRED)
So the answer is: yes, stocks do go down during recessions. This has always been the case in each recession in the last 40+ years.
Sell The News?
I think we may see a “sell the news” scenario in the coming weeks, where the news is the confirmation of a coming rate cut. The market’s logic here would be to take chips off the table because there will be a move to the exits sooner or later. Getting out right, as Powell has effectively confirmed a rate cut, could prove to be a popular choice.
Continued Rally?
We could also see an SP500 rally continuing toward 6000. This should not be surprising if it occurs. Eventually, I would expect this to turn around. This year has already been quite euphoric, being up over 18% YTD. A rally to 6000 by December could make this one of the best years in history. When this recession sets in and the pullback occurs, we could revisit sub-5000 levels. And that would only be a 17% drop from 6000— not exactly an outlier when it comes to market drawdowns.
Actionable Trades
My favorite hedge is a put ratio spread, where you buy 1 NTM put and sell 2 further OTM puts at 30-70 DTE. The underlying can be SPX, XSP, or SPY. Of the three, SPY and SPX options are the most liquid. XSP options give you a smaller size, basically the same as SPY, while also offering the tax benefits of index options.
The benefit of the ratio spread is that you can enter the hedge at no upfront cost, or even at an immediate cash credit. This trade is great for monetizing the implied volatility skew inherent to equity indices. OTM puts generally trade at an IV premium to OTM calls and ATM puts. Right now, OTM puts are trading at an even higher premium than normal because the skew is higher than normal. This means selling further OTM gives you a greater credit than normal.
I cover put ratio spreads in greater detail in this article from last month, when I first sounded the alarms about needing to have some kind of hedge.
What else could we do? Well, because the yield curve is steepening, we should also look for a position which can benefit us in that scenario. It turns out that such products exist and are actually accessible to retail investors. I quite like IVOL, a special ETF which holds swaptions on the 2-10 constant maturity spread. I go pretty in depth on IVOL in this article published a few weeks ago.
