tang90246
If like me, you are a fan of the old “classic” days of television’s Saturday Night Live, you may recall a skit about a Presidential debate including then-President Gerald Ford, played by actor Chevy Chase. The actor playing the debate moderator asks a question that sounds more like an SAT question, with lots of numbers and calculations.
Chase’s eyes are rolling around his head, and when he is prompted to answer, he simply says, “I was told there would be no math.” So, I tell you with fair warning: this article contains a lot of math. But it is all for a good cause: sizing up what is happening among the 11 S&P 500 sectors, and the ETFs that track them.
Conclusions from my sector price trend analysis
With all of the data I’m throwing into this below, it is best to start with my conclusions, at a high level. One of these 4 scenarios is most likely (not assured, but likely) from here, taking a 6-month view. Just for sport, I’ll assign “best-guess” percentage chances for each scenario.
- The laggards catch up, but only by losing less (40%)
- The laggards catch up by rising much faster, and the Magnificent 7 struggle, which has been the recent experience since mid-July (30%)
- The leaders re-assert themselves and tech romps again (20%)
- All or nearly all sectors fly still higher for a while (10%)
This is based on much more than my sector price trend analysis, and the distance from all-time highs of each sector, both cap weighted an equal weighted. That was the last step of an ongoing process that frankly has led me to the position where I am hard-pressed to find much of the US equity market that is poised for more than a trading move higher. I see a lot of heavy charts.
Yes, I know it is the “seasonally weak” part of the stock market year, September and October. But I have seen a strong chance of a “buy Memorial Day/sell Labor Day” situation since last spring. And I have positioned accordingly, with heavy doses of Utilities, REITs and consumer staples, mixed in with some industrials and a tad of tech and financials, as well as the rest.
In fact, in my YARP (Yield At a Reasonable Price) dividend stock portfolio, I am heavily hedged with put options, and I own a couple of income-oriented ETFs due to lack of strong commitment to stocks. Of the stock allocation I do have, the positions are mostly on the light side (1%-3% weightings) and few at 5%, my maximum weighting at cost. That produces a current sector allocation that looks like this:
Simply Safe Dividends (SungardenInvestment.com)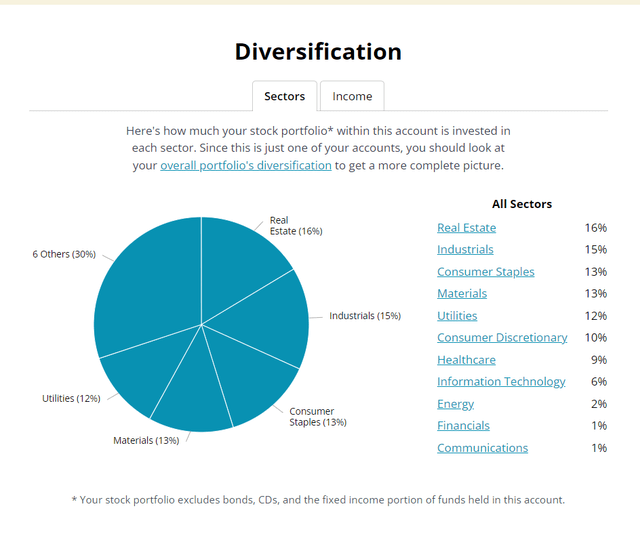
I’ll have a more detailed update on my progress in that portfolio in an upcoming article, along with a few stock-specific update articles.
S&P 500 sector analysis
I analyzed each sector from a specific angle: as of the end of last month, how close was it to its all-time high price? I looked at that history since the beginning of 2023, which is when the stock market, then up about 10% from the depths of a very poor 2022, really started to get in gear. By the end of 2023, the S&P 500 and Nasdaq had essentially erased their 2022 losses.
Some investors at that point in the market cycle were celebrating a great “bull market.” As I have written here several times this year, I saw 2023 as merely getting even for 2022’s drubbing. That made 2024 the “tie-breaker.”
What has happened over that 3-year period is that the whole market fell, but the recovery from sector to sector has been historically uneven. It is well known that the Magnificent 7 stocks and a relatively small number of others have carried the load. The big stock have become bigger.
But what about at the sector level? When I reviewed it (with lots of math involved), here’s what I found, using those 11 sector “Spider (SPDR)” ETFs:
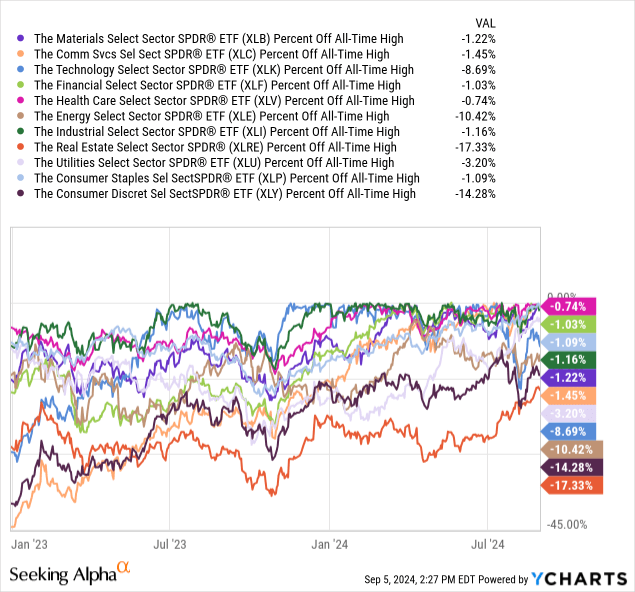
As of the end of August, 7 of the 11 S&P 500 sectors are within about 3% of their all-time highs. The other 4 are between 8% and 17% off their top levels. Here’s a chart of all 11, tracking how far they were off of their all-time highs at each point since the start of 2023.
It seems to me that the leaders have continued to be leaders, which is what the market has certainly felt like to me, apart from a handful of flurries of outperformance from the not-Magnificent 7 part of the market. Or, as one some clever analyst first described them, the “S&P 493.” As far as I know, there’s no ETF for that. Yet.
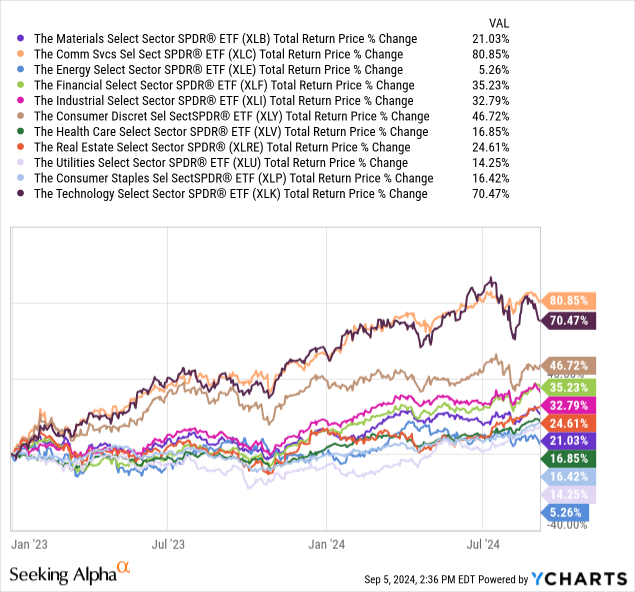
Next, I looked at the cumulative returns since the start of 2023 for those 11 sector ETFs. You can view them in color line chart form below, or just look at the table at the top, summarizing the cumulative gains including dividends over that 20-month period.
Tech roared, of course. And telecom did as well, topping the list with a more than 80% return. In simple math (no compounding), that’s 4% a month! Not bad.
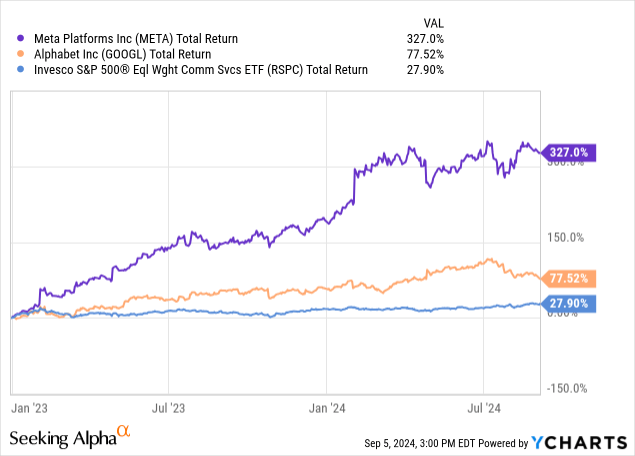
But as with most sectors the past few years, it was a top-heavy story. See below that META’s 327% gain over those 20 months accounted for the vast majority of that strong performance. META is now 23% of XLC, the communications sector ETF, and GOOGL (via 2 share classes) is another 21%. It didn’t hurt things, as it kept pace with XLC’s total gain.
But look at RSPC, the equal weighted ETF version of the exact same set of stocks. Up “only” 28%! Translation: S&P 500 sector performance has been very deceiving.
Now, let’s look at the other high-octane sector, technology. It too is dominated by a small number of stocks. Microsoft, is 22% of XLK, while Nvidia is 19% and Apple, once right up there with Microsoft, is still 5% of the cap-weighted tech sector.
That explains why while XLK is up 70% the past 20 months, when we look at RSPT, the equal-weighted version of that same index, where Nvidia and the rest are treated the same as all the other tech stocks, the gain is “only” 54%. Top-heavy is the best way to characterize what we’ve seen for most of 2023 and 2024.
Seeking Alpha (YCharts)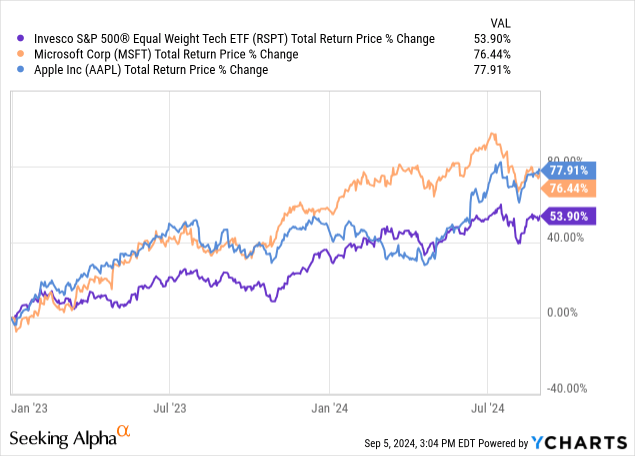
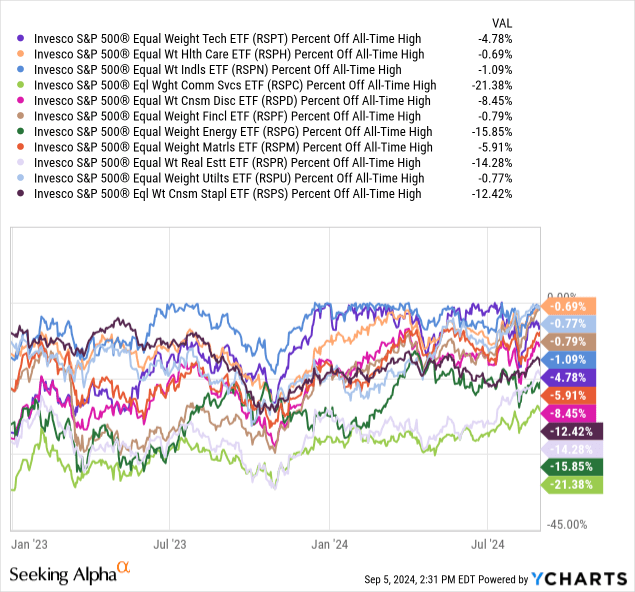
Here are all of the equal-weight ETFs, with distance below all-time highs, charted from the start of 2023 until recently. It is quite a different picture, as I summarize below the chart.
So here’s what we have:
Cap-weighted laggards (biggest % from all-time highs):
-
Energy
-
REITs
-
Consumer Discretionary
-
Technology
Equal-weight laggards (biggest % from all-time highs):
-
Energy
-
REITs
-
Consumer Staples
-
Communications
Yes, communications stocks not among the largest have been big underperformers. So have most consumer staples stocks. So those may be potential hunting grounds for investors.
Implications “at a glance”
Meanwhile, Energy and REITs made the bottom 4 in both lists, making them fair game to find fairer prices in the future. That is, to pick up some gains. These two are among the higher-yielding S&P 500 sectors, so that makes sense with bond rates slipping and the 10-2 yield curve spread about to finally return to its normal, non-inverted form.
This article is not about “what to buy now,” but rather presents part of a research process I think it’s helpful to narrow the field of potential stock holdings in the most complex stock market environment I’ve seen in 38 years of doing this professionally. However, complex is not bad. It is very, very good.
Opportunists and tactical, process-driven and unemotional investors have and will continue to be the most successful. And that should be the case until we finally have a true, generational “washout” in what has been a dot-com-like buildup of an “equity culture” where investors think of the stock market as a gift that keeps on giving. Yet, as my analysis of the sectors shows, it has a lot to do with where you have rotated to and from.
Or, if you happened to buy the Mag-7 a while back and held them. But while that has worked, the signs are increasing that the sands are changing underneath our feet, so to speak.
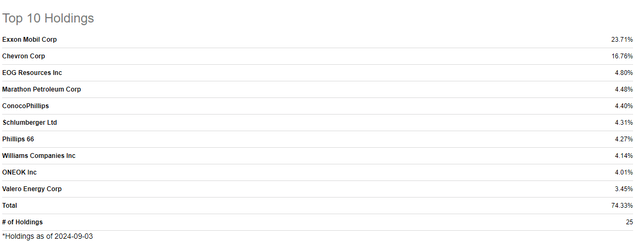
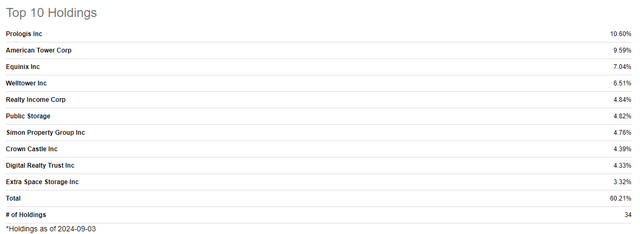
But to just touch on a few individual names here, these are the top-heavy holdings in XLE and XLRE, the 2 sectors that appear on both laggards lists above.
Here are the top 10 in Energy (XLE):
And here are the top 10 in REITs (XLRE):
I grabbed the 3 largest stocks in each of those sectors, and ran Seeking Alpha Quant Grades on them:
And here are their dividend grades. The yields range from 2.0% (PLD) to 4.6% (CVX).
I don’t draw any firm conclusions here, other than to say that profitability is and will be at a premium, as earnings are likely to stagnate going forward, with the broader economy. So highly profitable, above-average yielding stocks have been and will continue to be my personal focus.
About those “all-time highs”
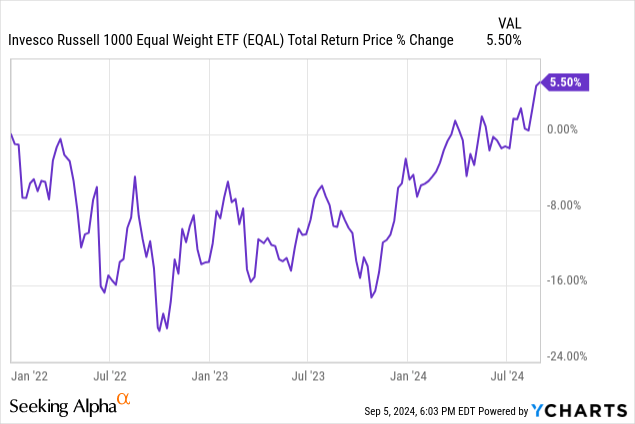
But this is more than just an exercise in number-crunching data concerning distance from all-time high prices of sector ETFs. An all-time high can mean a lot of things. For instance, I recently studied, published and created something I affectionately refer to as the “zero return club.”
For instance, this chart helps explain why a lot of those equal-weighted sector ETFs are not keeping up with their cap-weighted peers. From the start of 2022 through just a few weeks ago, the average stock in the 1,000 largest stocks got back to the all-time high it reached more than 31 months earlier.
There’s a name for that: zero return!
And looking back at XLK, the top-heavy tech sector ETF, it spent much of 2024 making new highs, before sliding 18% in a matter of weeks. That leaves puts it in the zero-return club since early March. That is, a 6-month roller coaster up and down around 20%.
Seeking Alpha (YCharts)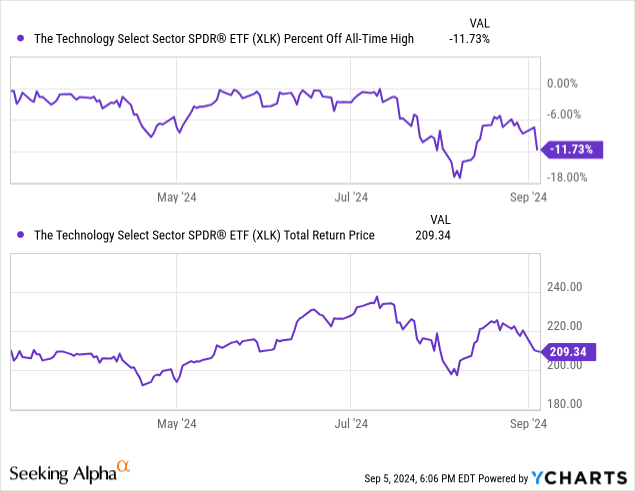
Actionable conclusions
- The stock market is carving out its own unique set of trends, post-pandemic. That has produced an outsized gap between recent past winners and losers.
- As noted toward the top of this article, I see 4 potential scenarios, and they lean toward a weak market at best over the next 6 months.
- That said, as a tactical investor, I will be very willing to “ride the wave” another leg higher, be it led by tech or any other sector. But from my chart work, that’s going to be a heavy lift from here.
- Treasury bills, notes, and bonds look like a better reward-risk tradeoff here
- As such, the ETF-centric portfolio I run has only 15% in equity exposure, plus put and call options that aim to exploit a sudden, strong move in the S&P 500 in either direction this autumn.


