


mayo5
The other day a friend of mine asked me when I thought the next Black Swan event would happen, whether it be a war, disease, political unrest, or crash-landing type recession.
Well, as most of my readers know, I’m not in the business of predicting the future, and contrary to what many of the talking heads on TV might want you to believe, no one really is, or at least no one is consistently good at it.
Don’t get me wrong, it is only natural to have some sort of forecast in your head when making investment decisions, it’s just not really possible to consistently make money off these forecasts.
So while I keep macroeconomics in mind, I’m really focused on the company, or as you might say, I like to take a bottom up approach.
Nevertheless, this really isn’t what my friend wanted to hear, so I thought I’d come up with a list of safe investments that can weather any storm, or Black Swan event, that may be on the horizon.
That being said, at the right price the picks below can be good investments regardless of what the economy is doing, good or bad, so long as you have a long-term investment horizon.
I also want to make the distinction between a company operating well through various economic conditions compared to how its stock is performing.
A great example of this is how real estate investment trusts (“REITs”) performed over the last several years.
REITs as a group suffered as interest rates rose and some REITs had true operational impairments unrelated to interest rates, such as office buildings with low occupancy rates.
However, many REITs operationally performed well, despite rising rates, but still saw massive stock price declines.
A couple of examples that come to mind are Realty Income (O) and Agree Realty (ADC). Both grew operating income, and both increased their respective dividend, but the increased cash flow and dividend growth was not reflected in the stock price of either company, as a matter of fact, just the opposite.
A bottom up approach does a good job of identifying companies that operate well through various cycles and companies that are financially strong, but nothing can predict what the stock market will do.
All of this is to say that these picks below have a track record of consistent performance and should continue to deliver operational returns through the next Black Swan event.
The second part of the equation is a strong balance sheet to help weather the storm.
If a company can consistently generate cash flow, through multiple cycles, and is in good financial shape, it should do well through the next Black Swan event. At least operationally well, which is really what I’m concerned about, and all I can make an educated forecast on.
Realty Income — O
This S&P 500 (SP500) company is a REIT that has delivered consistent results since its IPO in 1994. Realty Income is a net lease REIT that invests in commercial properties across all 50 states and multiple countries throughout Europe.
O invests in freestanding, single-tenant buildings that are leased on a triple-net basis. The leases are long-term, with contractual revenues in place that provide clear visibility into future cash flows.
Realty Income has generated positive adjusted funds from operations (“AFFO”) growth in 27 out of the last 28 years, and has a median AFFO growth rate of 5.7% since 1996. Plus, the company is an S&P 500 Dividend Aristocrat that has increased its dividend for 29 consecutive years at a compound annual dividend growth rate of 4.3%.
Realty Income has a 335.3 million SF portfolio comprising 15,450 properties leased to more than 1,500 tenants operating across 90 industries. At the end of 2Q-24, the portfolio had a physical occupancy of 98.8% and a weighted average lease term (“WALT”) of 9.6 years.
The company has an investment grade balance sheet with a A3/A- credit rating from Moody’s and S&P and solid debt metrics including a net debt to pro forma adjusted EBITDAre of 5.3x, a long-term debt to capital ratio of 40.97%, and a fixed charge coverage ratio of 4.6x. O’s debt is 99% unsecured, 94% fixed rate, and has a weighted average term to maturity of 6.3 years.
When it comes to preparing for the next Black Swan event, I can’t think of a company I’d want to be invested in more. Realty Income is the total package. It has a large, diversified portfolio that includes retail, gaming, and industrial properties and its assets are diversified across the U.S., the U.K., France, Germany, Spain, Italy, and several other countries in Europe. Additionally, the company pays a high yield, has a strong balance sheet, and a history of operational excellence.
O pays a 5.07% dividend yield that is well covered with a 2023 AFFO payout ratio of 76.27%. Analysts expect AFFO per share to increase by 3.0% in 2025 and then by 4.0% the following year. The stock is currently trading at a P/AFFO of 15.06x, compared to its average AFFO multiple of 18.41x.
We rate Realty Income a Buy.
FAST Graphs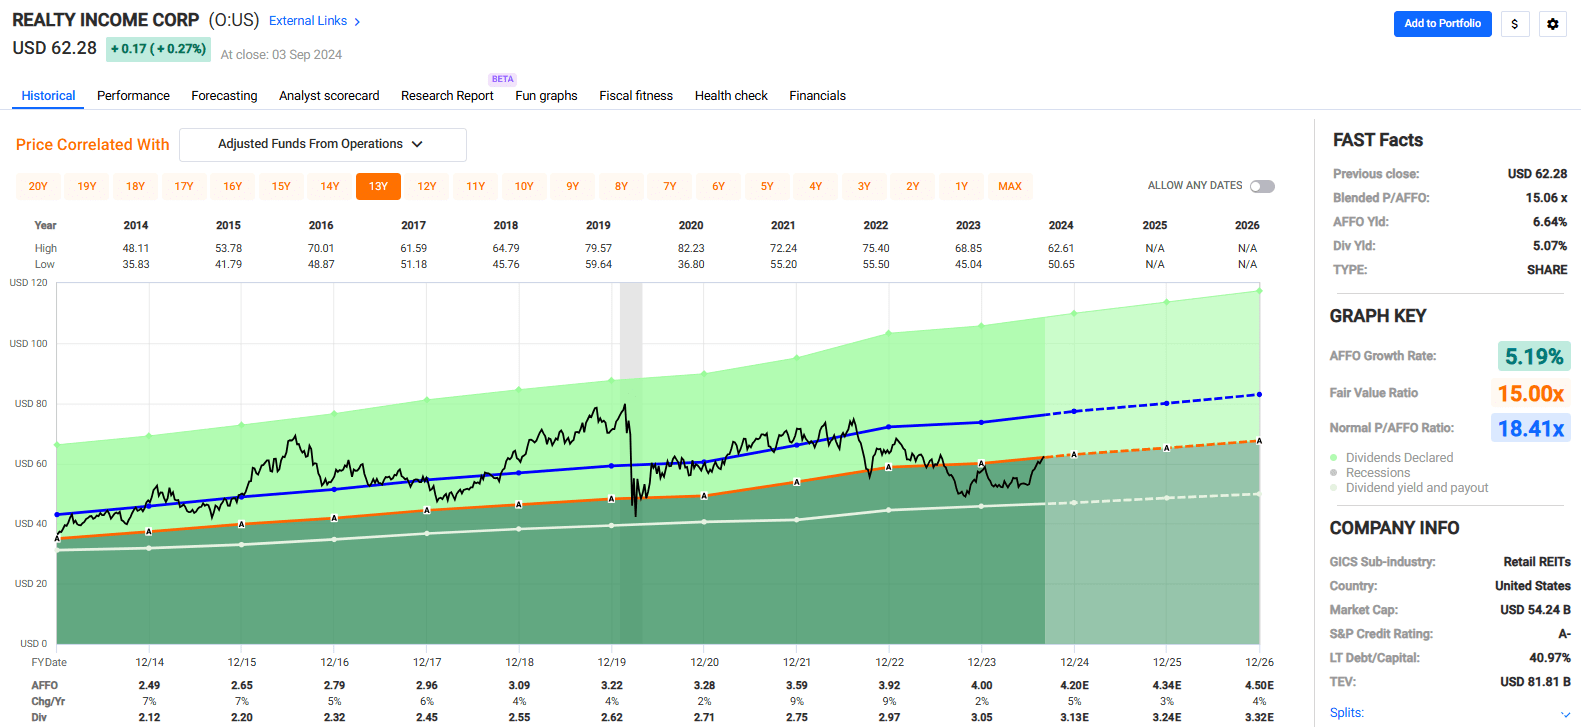
Agree Realty — ADC
ADC is a REIT that specializes in the development, acquisition, and management of net leased retail properties across the U.S. The company has a market cap of $7.5 billion and a 45.8 million SF portfolio made up of 2202 properties located in 49 states. At the end of 2Q-24, the company’s portfolio was 99.8% leased and had a WALT of 8.1 years.
In some ways, Agree Realty is like a smaller, younger version of Realty Income. Both companies are net lease REITs that pay monthly dividends, and both focus on defensive retail sectors. However, that is just about where the similarities end.
ADC focuses on domestic properties and does not have international investments. Similarly, ADC focuses exclusively on retail properties and does not invest in industrial, or other property types.
Agree Realty places a strong emphasis on the fungibility of a property and does not invest in single-use assets. Additionally, the company has a portfolio of high-quality ground leases that made up 11.3% of its annualized base rent (“ABR”) in 2Q-24.
ADC has a strong focus on tenant quality, as 68.4% of its ABR is derived from investment grade retail tenants.
To me, that is one of the things that really stands out about ADC. The company has an impressive list of tenants that lease high-quality properties. ADC is all about quality. High-quality tenants and a high-quality net lease portfolio.
The company also has a high-quality balance sheet. In July of this year, the company announced that it received an upgrade from S&P Global and now has a BBB+ credit rating. ADC has excellent debt metrics. The company has a pro forma net debt to EBITDA of 4.1x, a long-term debt to capital ratio of 34.5%, and a fixed charge coverage ratio of 4.7x.
Over the last decade, the company has delivered positive AFFO per share growth in each year. In 2014, the company reported AFFO per share of $2.22, compared to $4.14 expected in 2024. Over the last 10 years, the company has delivered an average AFFO growth rate of 5.99% and an average dividend growth rate of 5.94%.
ADC pays a 4.09% dividend yield that is well covered with a 2023 AFFO payout ratio of 73.90%. Analyst expect AFFO per share to increase by 4% in both 2025 and 2026 and currently the stock is trading at a P/AFFO of 5.99%, compared to its average AFFO multiple of 18.52x.
We rate Agree Realty a Hold.
FAST Graphs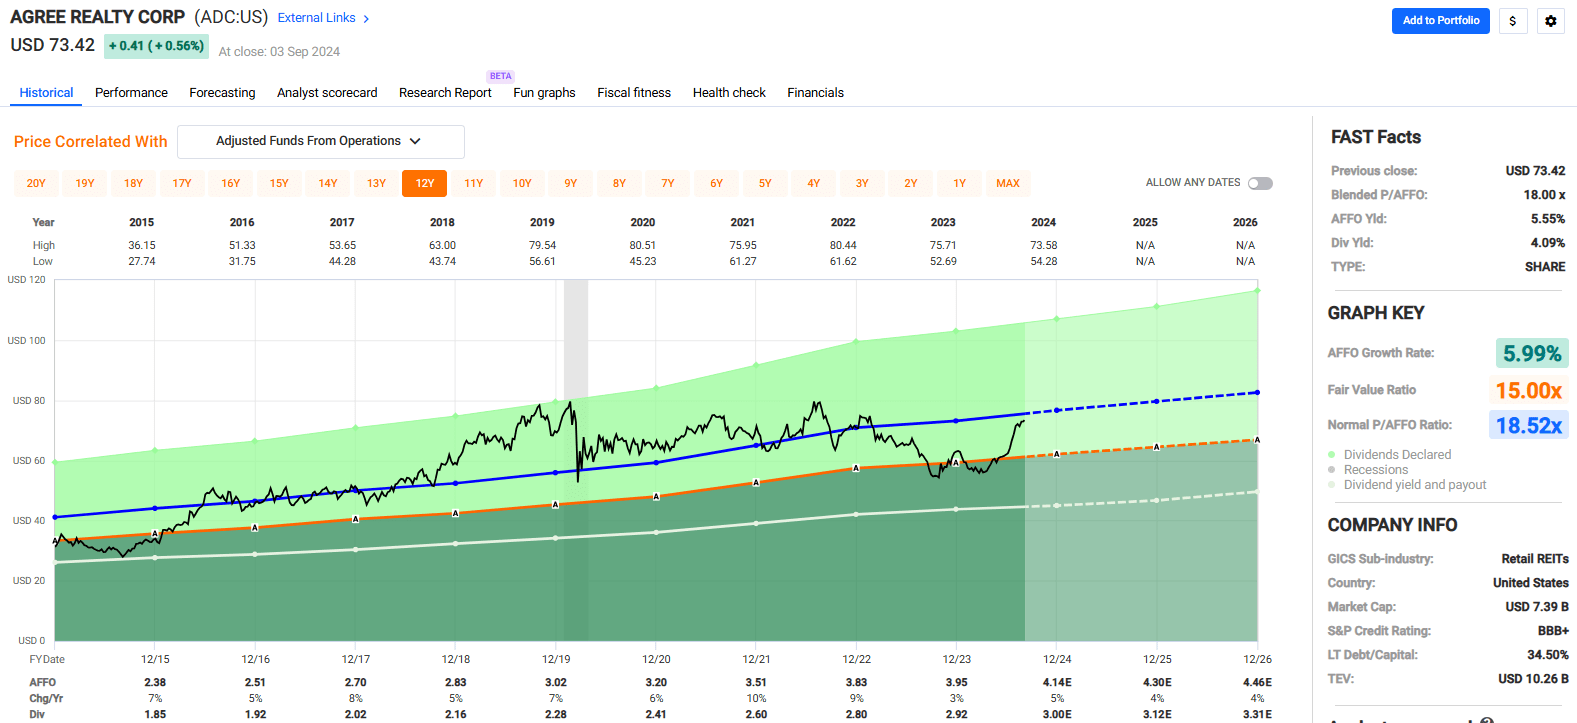
NNN REIT, Inc. (NNN)
NNN is a net lease REIT that owns 3,548 properties covering 36.1 million SF across 49 states. The company specializes in the acquisition and operation of single tenant, freestanding net lease retail properties.
At the end of 2Q-24, the company’s portfolio was 99.3% occupied and had a WALT of 10.0 years.
The company’s strategy is to acquire freestanding retail properties that are well positioned within the tenants’ respective market. NNN believes single-tenant, net leased properties will continue to provide attractive returns and that it has the experience and expertise to take advantage of opportunities in the space.
NNN has 375 tenants operating across more than 35 lines of trade. Its top state by property count is Texas with 553 properties, followed by Florida and Ohio with 282 and 195 properties.
The company’s largest line of trade is automotive services, which made up 16.7% of its ABR in 2Q-24, followed by convenience stores and limited service restaurants, which made up 16.2% and 8.5%, respectively.
7-Eleven is NNN’s largest tenant, followed by Mister Car Wash and Camping World. Other notable tenants include Dave & Buster’s, BJ’s Wholesale Club, and Bob Evans.
Except for 2020, during the pandemic, NNN’s conservative net lease business model achieved positive AFFO growth in each year between 2011 and 2023. The company’s consistent performance enabled it to increase its dividend for 35 consecutive years, which is the third-longest record of all public REITs.
NNN has a BBB+ credit rating from S&P Global and solid debt metrics including a net debt to EBITDA of 5.62x, a long-term debt to capital ratio of 51.16%, and a fixed charge coverage ratio of 4.2x. In addition to its solid debt metrics, the company has well-laddered debt maturities, with a weighted average debt maturity of 12.6 years.
Over the last decade, NNN has had an average AFFO growth rate of 4.44% and an average dividend growth rate of 3.38%. Analysts expect AFFO per share to increase by 3% in 2025 and in 2026. NNN pays a 4.83% dividend yield that is well covered with a 2023 AFFO payout ratio of 68.40% and the stock is currently trading at a P/AFFO of 14.43x, compared to its average AFFO multiple of 16.99x.
We rate NNN REIT a Buy.
FAST Graphs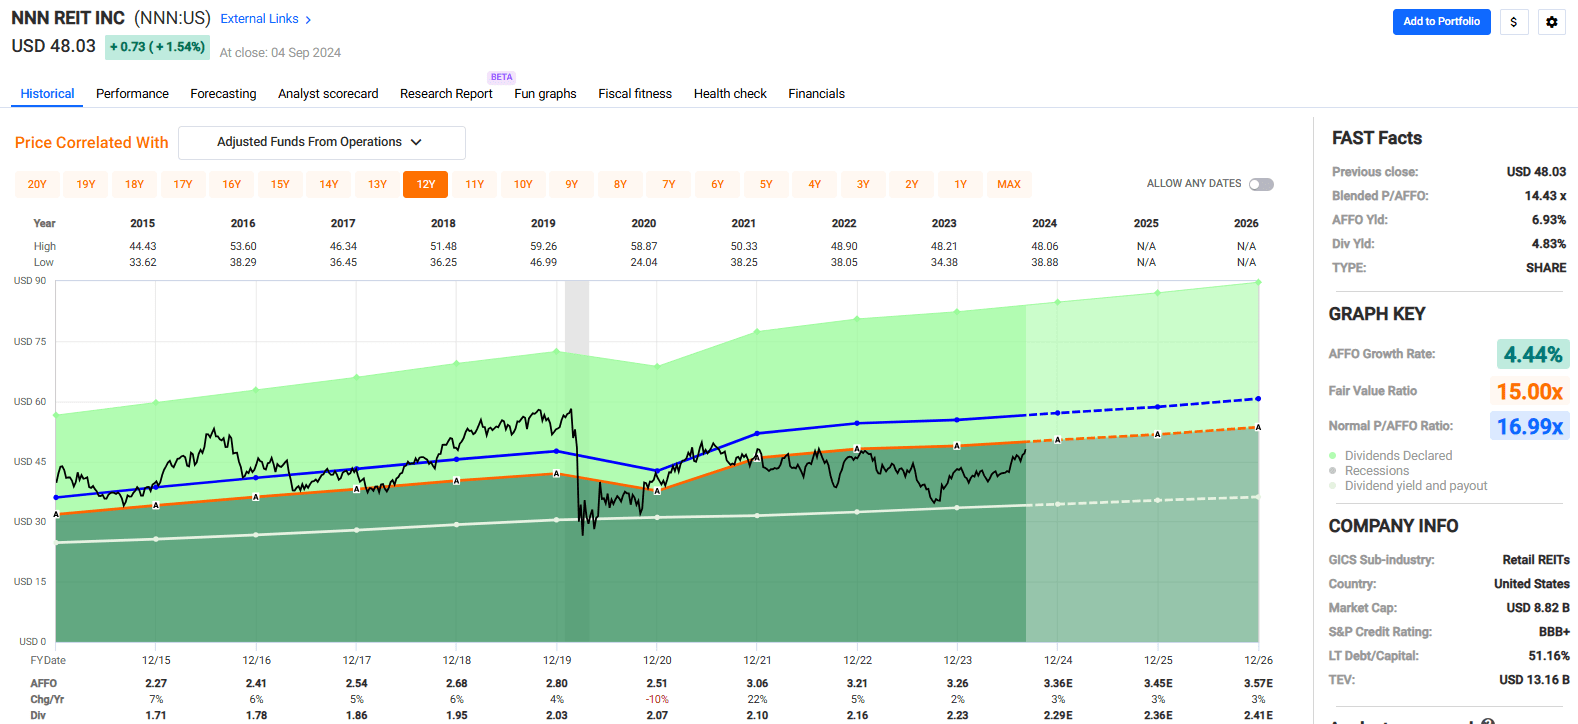
Regency Centers Corporation (REG)
REG is a shopping center REIT that specializes in the development, acquisition, and operation of grocery-anchored shopping centers across the United States. The S&P 500 company has a market cap of roughly $13.4 billion and a 60.0 million SF portfolio made up of over 480 properties leased to more than 9,000 tenants.
REG invests in various shopping centers, but has a particular interest in retail properties anchored by a grocery store. 80% of the company’s properties are grocery-anchored shopping centers. The company seeks properties in affluent, densely populated areas that are open-air and include a major grocer such as Kroger, Whole Foods, or Publix.
The company has a strong footprint across coastal markets in the U.S., with a particularly heavy presence in the Northeast as well as California and Florida. REG derives approximately 23% of its ABR from the Northeast, roughly 23% from California, and around 19% from Florida. Other prominent regions for REG include the Mid-Atlantic which makes up ~8% of its ABR and Texas which makes up ~7%.
Since 2015, Regency has achieved positive AFFO per share growth in each year except 2020. Over this period, the company had an average AFFO growth rate of 4.28% and an average dividend growth rate of 3.55%.
REG has a BBB+ credit rating from S&P Global. Plus, in February of this year, Moody’s upgraded the company’s credit rating to A3. The company has strong debt metrics including a net debt plus preferred to EBITDAre of 5.2x, a long-term debt to capital ratio of 41.81%, and a fixed charge coverage ratio of 4.5x.
REG has had an average AFFO growth rate of 4.28% and an average dividend growth rate of 3.55% since 2015. Analysts expect AFFO per share to increase by 5% in 2025 and then by 6% the following year. REG pays a 3.68% dividend yield that is well covered with a 2023 AFFO payout ratio of 77.06% and the stock is currently trading at a P/AFFO of 21.06x, compared to its average AFFO multiple of 21.97x.
We rate Regency Centers a Hold.
FAST Graphs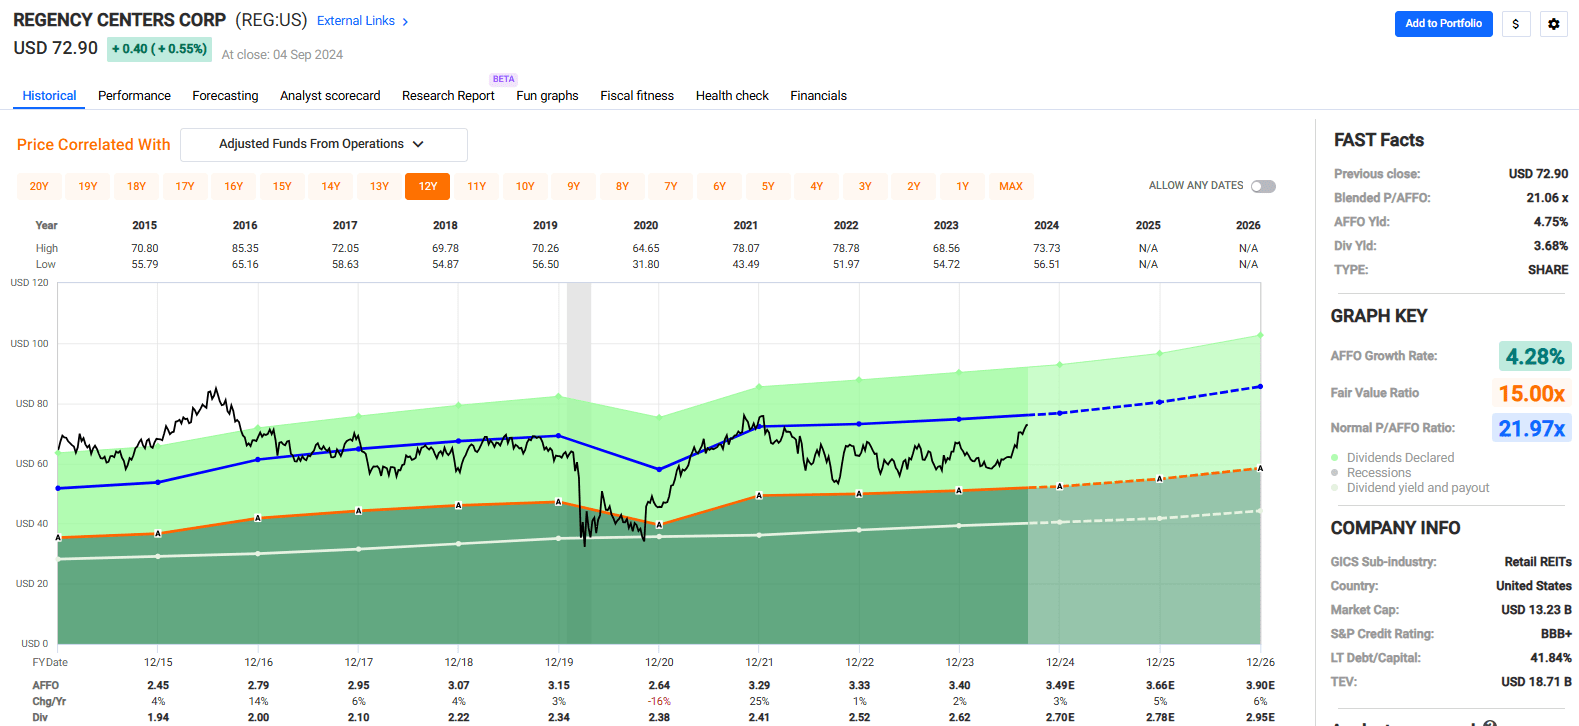
Kimco Realty Corporation (KIM)
KIM is a REIT focused on open-air, grocery-anchored shopping centers located in first-ring suburbs of key markets across the U.S. The shopping center REIT’s main focus is high-barrier-to-entry coastal markets as well as high-growth sunbelt markets.
Kimco looks for retailers with an established omnichannel presence that provide essential goods and services which cannot be duplicated online. KIM has a market cap of $15.6 billion and a 101.0 million SF portfolio made up of 567 shopping centers and mixed-use assets in the United States.
Some of the company’s top tenants include TJX, Home Depot, Ross, and Whole Foods. KIM’s top tenant is TJX which makes up 3.8% of its ABR.
The company released its second quarter operating results in August and reported total revenue of $500.2 million during 2Q-24, versus total revenue of $442.8 million in 2Q-23.
FFO during the quarter was reported at $276 million, or $0.41 per share, versus FFO of $243.9 million, or $0.39 per share in the second quarter of 2023.
During 2Q-24, Kimco leased 2.3 million SF at a blended pro rata cash rent spread of nearly 12% for comparable renewals and generated cash rent spreads of roughly 26% on comparable new leases.
Additionally, the company raised its 2024 guidance for FFO per share from a midpoint of $1.58 per share to a midpoint of $1.61 per share.
Analysts expect AFFO per share to increase by 4% in 2024 and then increase 4% each year in 2025 & 2026.
KIM has an investment grade balance sheet with a BBB+ credit rating from S&P Global. The company has solid debt metrics including a look-through net debt to EBITDA of 5.8x, a long-term debt to capital ratio of 42.50%, and fixed charge coverage ratio of 4.2x.
KIM has plenty of dry powder to fuel continued growth as well. The company currently has $128 million in cash and equivalents, as well as $1.8 billion of availability on its credit facility.
Plus, so far, the company has generated between $300 million to $350 million in proceeds from dispositions and on average generates roughly $140.0 million of annual free cash flow, after dividends and any capital expenditures are paid.
Kimco was founded in 1958 and went public in 1991. The company has decades of experience managing shopping center properties and has grown to become one of the largest publicly traded shopping center REITs.
KIM pays a 4.11% dividend yield that is well covered with a 2023 AFFO payout ratio of 86.44%. Currently, the stock is trading at a P/AFFO of 19.24x, compared to its average AFFO multiple of 19.07x.
We rate Kimco a Buy
FAST Graphs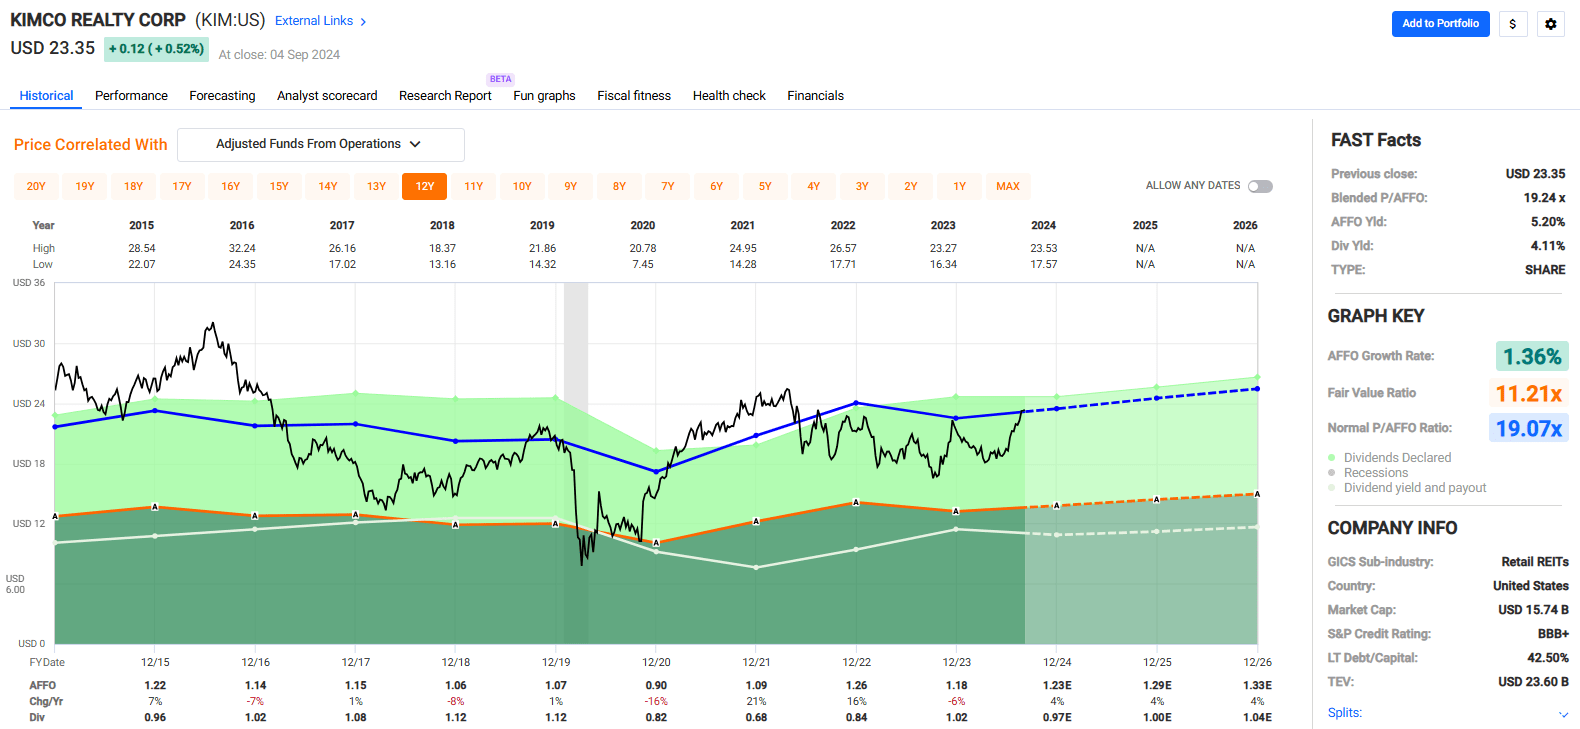
Mid-America Apartment Communities, Inc. (MAA)
MAA is an S&P 500 company that specializes in acquiring, developing, and managing a portfolio of multifamily communities that are primarily located in fast-growing sunbelt markets.
The company has a market cap of approximately $18.8 billion and a portfolio made up of 103,614 apartment homes located in 16 states and Washington, D.C.
MAA attempts to diversify its portfolio by market, submarket, property classification, and property types. Most of MAA’s apartment buildings are garden style, meaning they are 3 stories or fewer, but they also offer mid- and high-rise multifamily communities.
The company’s top market is Atlanta, from which it receives 11.8% of its annual rent, followed by Dallas and Tampa, which generates 9.4% and 7.1% of the company’s ABR, respectively. By market size, 70% of the company’s portfolio is located in large markets, while 30% is located in mid-tier markets.
A big overhang for apartment REITs in general, but especially apartment REITs concentrated in the sunbelt, has been the new supply that has been coming to market over the last year or so. Addressing this, MAA’s CEO Eric Bolton, stated:
“Results for the second quarter were ahead of expectations. New supply delivering into several of our markets continues to be absorbed in a steady manner as the demand for apartment housing remains strong. We continue to believe that we will begin to see a decline in new apartment deliveries over the back half of this year and into 2025.”
MAA is investment grade with an A- credit rating from S&P Global. The company has excellent debt metrics including a total debt to adjusted total assets ratio of 28.1%, a net debt to adjusted EBITDAre of 3.7x, and a debt service coverage ratio of 7.4x.
Nearly all the company’s debt is fixed rate at 93%, and it has an average interest rate of 3.8% with a weighted average term to maturity of 7.4 years.
MAA has achieved an average AFFO growth rate of 5.82% and an average dividend growth rate of 7.37% since 2015. Since its IPO, the company has delivered consistent and reliable results and has paid 122 quarterly cash dividends since 1994.
Over the last 30 years, the company has paid a quarterly dividend and has never suspended or reduced its dividend over this period.
MAA has a solid record of growth and stability. The company pays a 3.61% dividend yield that is well covered with a 2023 AFFO payout ratio of 67.96% and the stock is currently trading at a P/AFFO of 20.35x, compared to its average AFFO multiple of 19.53x.
We rate Mid-America Apartment a Buy.
FAST Graphs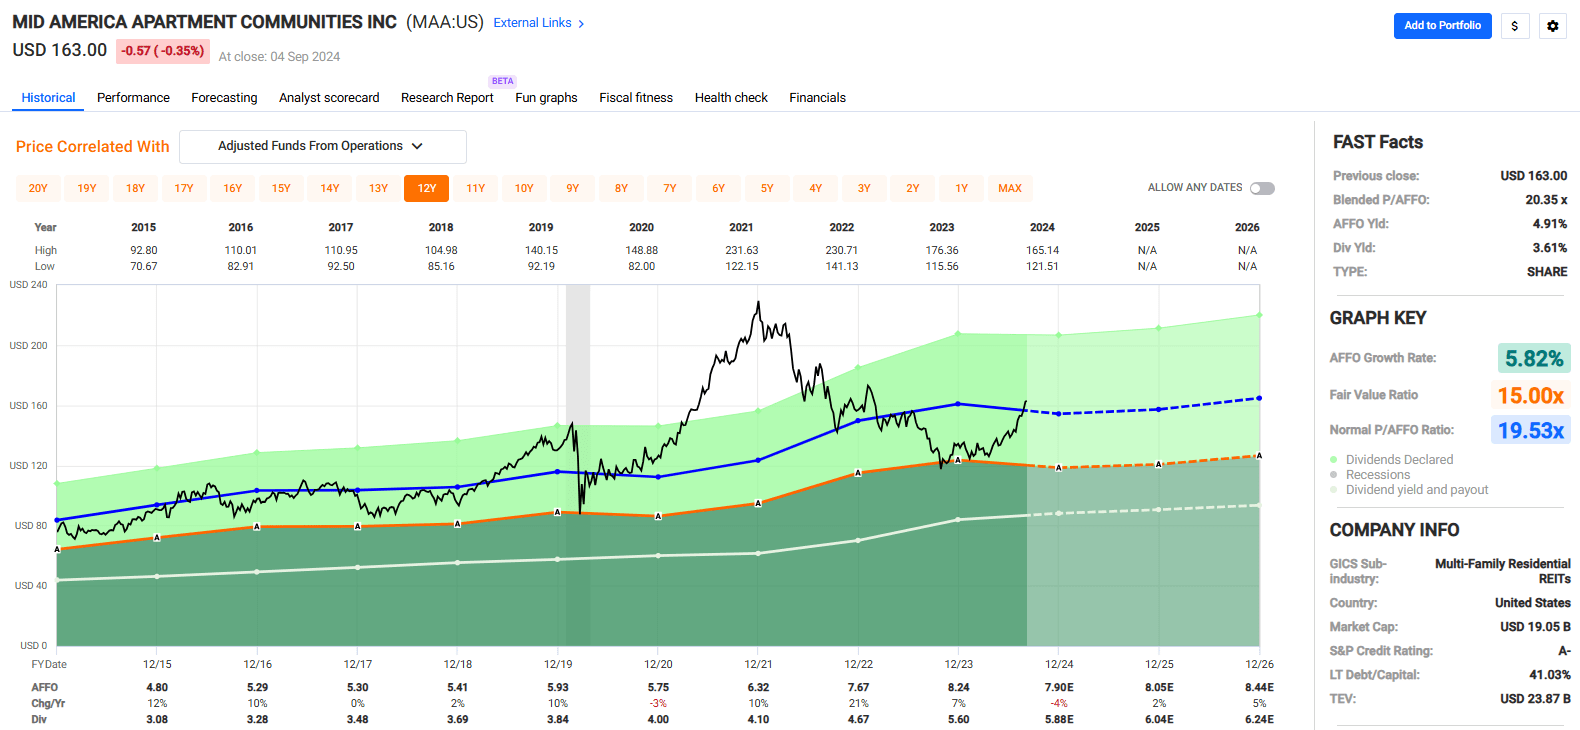
Camden Property Trust (CPT)
CPT is a multifamily REIT that also has a strong focus on sunbelt markets. The company specializes in the development, acquisition, and management of multifamily communities across 15 major markets in the U.S.
Camden Property has a market cap of approximately $13.2 billion and a portfolio made up of 171 operating communities comprising 58,601 apartment homes that vary by building type and asset class.
At 62%, the majority of the company’s portfolio is made up of Class B apartment buildings. 58% are located in suburban areas, verses 42% in urban areas, and 60% of its properties are low-rise buildings.
The portfolio’s average age is 15 years and its average monthly rental rate per unit is $1,994.00. At the end of the second quarter, the company reported an average occupancy of 95%.
In addition to its operating properties, the company has 4 communities in development which are expected to add nearly 1,200 apartment homes upon completion.
While CPT’s portfolio is primarily concentrated in sunbelt markets, its largest market happens to be the Washington, D.C. Metro area, which makes up 13.0% of its net operating income (“NOI”).
The company has a particularly large presence in Texas and Florida with properties located in Dallas, Austin, Houston, Orlando, Tampa, and Southeast Florida. As a percentage of NOI, these markets make up the following:
- Houston: 11.5%
- Dallas: 8.4%
- Austin: 4.8%
- Orlando: 6.4%
- Tampa: 6.1%
- Southeast Florida: 7.1%.
Camden Property has an A- credit rating from S&P Global and a strong capital structure with nearly 91% unsecured debt and 84.9% fixed rate debt. The company’s debt carries a weighted average interest rate of 4.2% and has a weighted term to maturity of 6.5 years.
Additionally, the company has excellent debt metrics with a net debt to EBITDA of 3.83x, a long-term debt to capital ratio of 38.86%, and an EBITDA to interest expense ratio of 6.87x.
CPT has had an average AFFO growth rate of 4.97% and a compound dividend growth rate of 4.73%. Analysts expect AFFO per share to fall by -2% in 2024, but then for AFFO to increase by 2% in 2025 and then increase by 6% in 2026.
The company pays a 3.28% dividend yield and its stock is currently trading at a P/AFFO of 21.43x, compared to its average AFFO multiple of 22.00x.
We rate Camden Property Trust a Buy.
FAST Graphs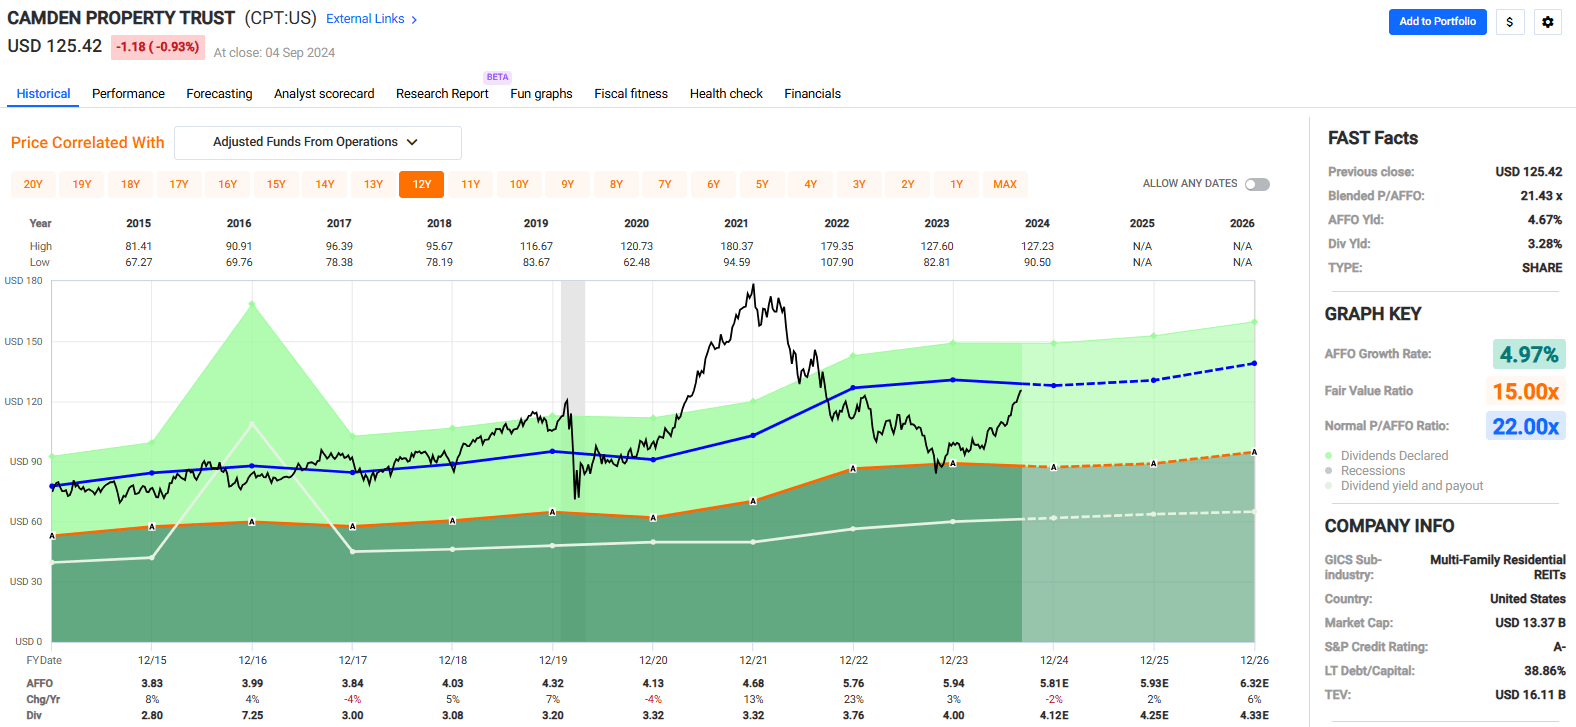
Prologis, Inc. (PLD)
PLD has a market cap of roughly $118 billion, making it the largest publicly traded industrial REIT. The company invests in industrial real estate around the world with a global portfolio focused on high-growth, high-barrier markets.
The company has a 1.2 billion SF portfolio comprising 5,576 buildings that are leased to a diverse tenant base of roughly 6,700 customers in 19 countries and across 4 continents. Some of its customers include well-established companies such as Amazon, Home Depot, FedEx, DHL, and UPS.
To put the company’s size into perspective, $2.7 trillion, or 2.8% of the world’s GDP, flows through the company’s distribution centers each year.
While PLD has properties across the world, it derives the vast majority of its NOI from the United States. Prologis has properties totaling 799.0 million SF in the U.S. that generate ~86% of the company’s net operating income. The company’s second-largest region is Europe, which generates 8% of its NOI.
Measured by square footage within the U.S., the company’s largest market is Southern California, which represents 13.8% of its total square footage, followed by Chicago which makes up 7.5%, and Atlanta which makes up 6.1%.
By net operating income, the company’s largest U.S. market is Southern California which made up 20.2% of its second quarter NOI, followed by New Jersey / New York and Chicago which made up 9.0% and 5.7%, respectively.
The company’s largest tenant is Amazon, which makes up 5.1% of its net effective rent. In total, PLD’s top 10 customers only make up 15.0% of its net effective rent.
Prologis is A3/A rated by Moody’s and S&P Global and has excellent debt metrics with a debt to adjusted EBITDA of 4.6x, a long-term debt to capital ratio of 36.26%, and a fixed charge coverage ratio of 7.6x. The company’s debt has a W.A. interest rate of 3.1% and a weighted average term to maturity of 9.3 years.
Plus, the company has $5.8 billion of liquidity.
PLD has delivered an average AFFO growth rate of 12.28% and an average dividend growth rate of 12.14% over the past decade. While analysts expect AFFO per share to fall by -4% in 2024, they expect AFFO to increase by 16% and 11% in the years 2025 and 2026, respectively.
PLD pays a 2.99% dividend yield and trades at a P/AFFO of 29.08x, compared to its average AFFO multiple of 27.52x.
We rate Prologis a Hold.
FAST Graphs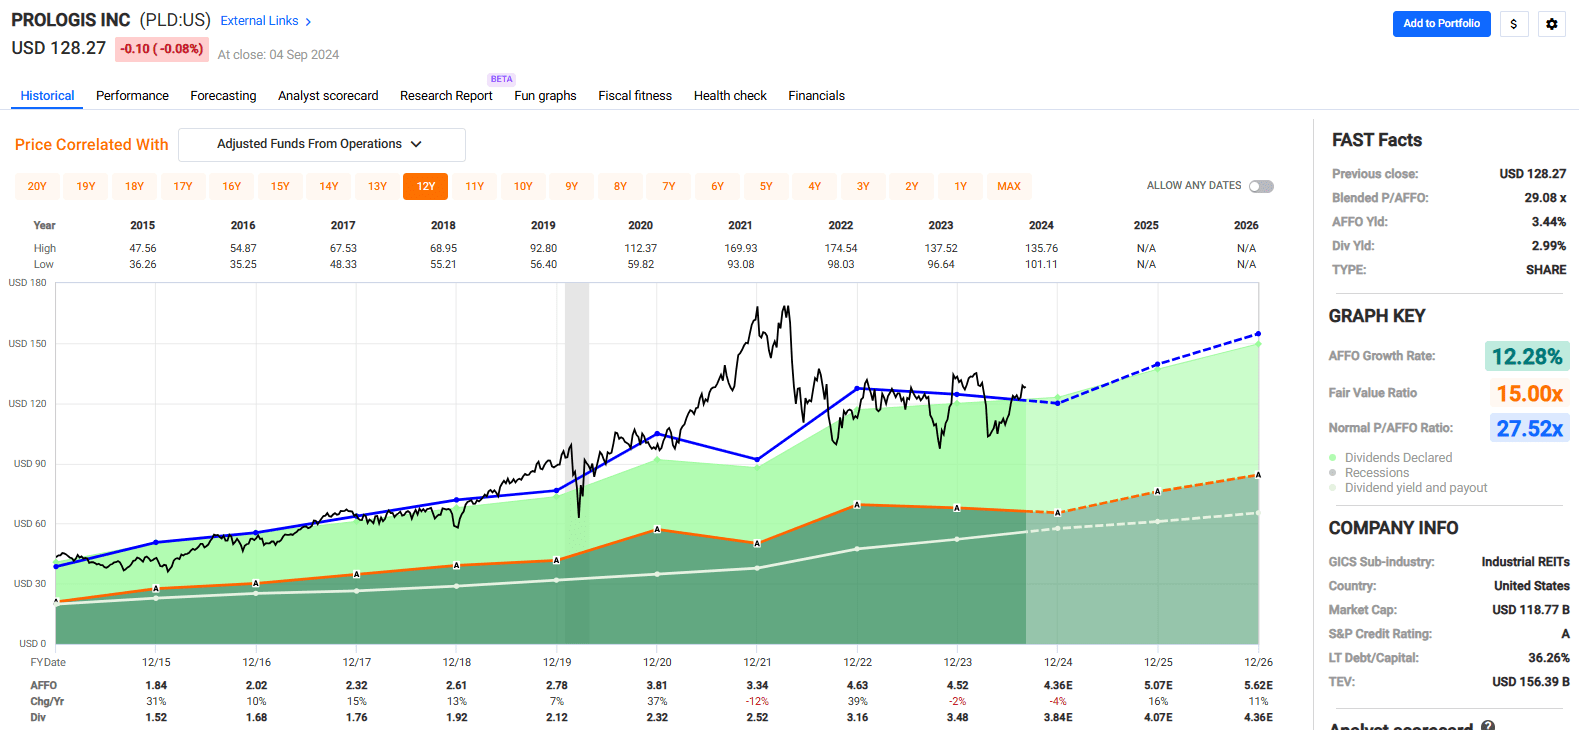
Rexford Industrial Realty, Inc. (REXR)
While Prologis has properties all over the world, REXR takes a different approach and exclusively focuses on industrial properties throughout infill Southern California (“SoCal”).
The company is laser focused on this region as it has massive demand with roughly 600,000 businesses and 24 million residents, yet the developable land in the region is constrained due to natural barriers such as mountains and the ocean, as well as restrictive government regulations.
REXR has a market cap of approximately $11.0 billion and a 50.0 million SF portfolio made up of 422 properties including warehouses, distribution centers, and light manufacturing facilities. The company strategically looks for and acquires properties located near major transportation hubs, including ports, highways, and airports.
Additionally, REXR looks for value-add opportunities, where under-managed properties can be repositioned to unlock value. The company targets properties in infill locations with strong demand and limited supply that can be redeveloped or repositioned to achieve superior investment returns.
Rexford has an investment grade rated balance sheet with a BBB+ from S&P Global. The company has excellent debt metrics, including a net debt to adjusted EBITDA of 4.6x and a net debt to total enterprise value of 24.1%.
REXR’s debt has a W.A. interest rate of 3.8% and a W.A. term to maturity of 4.2 years, plus the company has $2.0 billion of total liquidity and minimal debt maturities through 2025.
Since 2015, the company has delivered an average AFFO growth rate of 8.97% and an average dividend growth rate of 25.38%. Analysts expect AFFO per share to increase by 14% in both 2025 and 2026.
REXR pays a 3.31% dividend yield and trades at a P/AFFO of 27.21x, compared to its average AFFO multiple of 36.63x.
We rate Rexford Industrial Realty a Buy.
FAST Graphs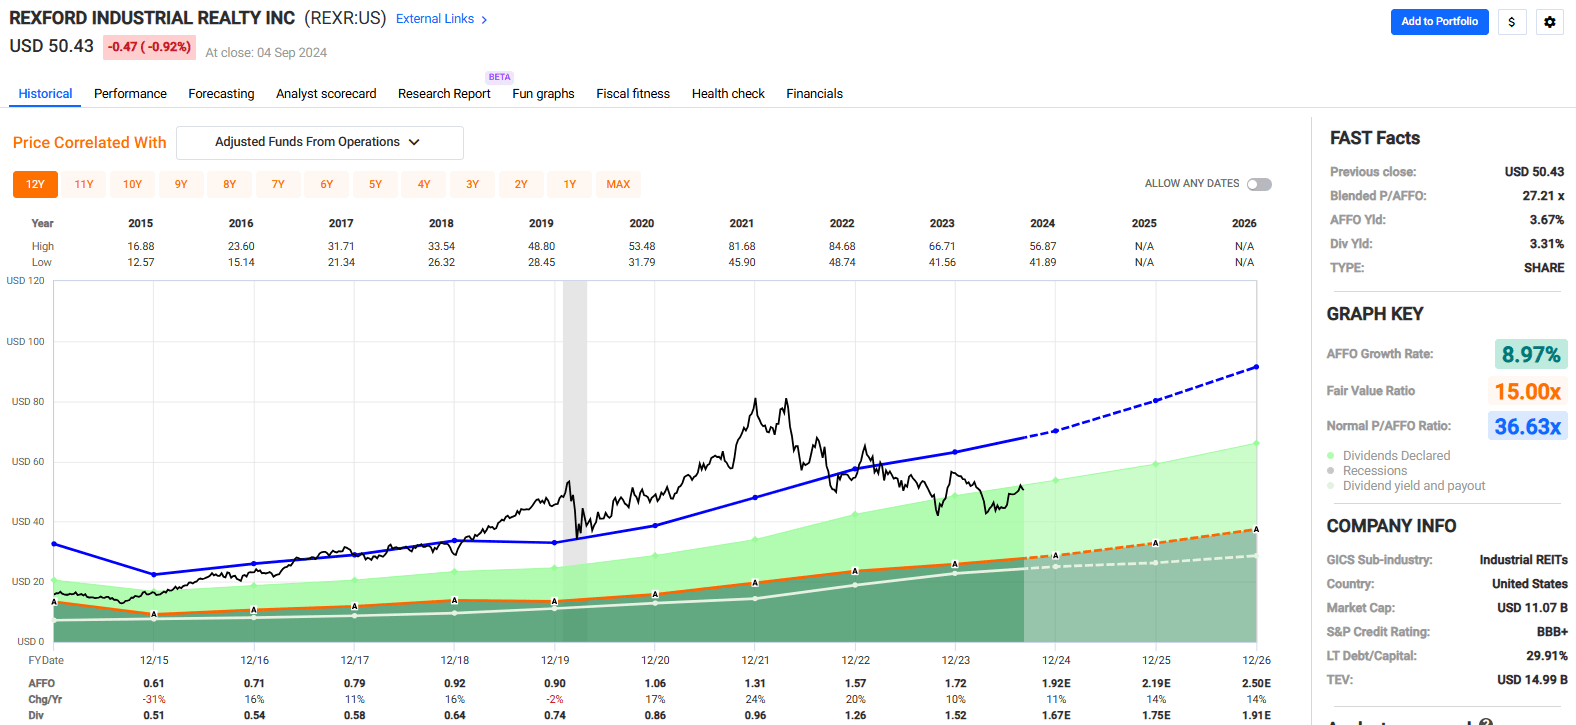
VICI Properties Inc. (VICI)
VICI is an experiential REIT engaged in the ownership and management of top-tier gaming, hospitality, and entertainment destinations.
The gaming REIT has a 127.0 million SF portfolio comprising 93 income-producing properties that include 54 gaming facilities and 39 non-gaming experiential properties that are primarily bowling alleys.
VICI is probably best known for its iconic trophy properties that are located on the Las Vegas Strip. Some of its more well-known properties include Caesars Palace, the Venetian, and MGM Grand. In total, VICI’s gaming facilities contain over 4 million SF of gaming space and include over 60,000 hotel rooms, roughly 500 restaurants, bars, and nightclubs, and has convention spaces totaling ~7 million SF.
To top it off, the company also owns 4 championship golf courses and 33 acres of undeveloped land next to the Las Vegas Strip.
While VICI is categorized as a gaming REIT, the company’s leases are structured on a long-term, triple-net basis. The company’s portfolio has one of the longest WALTs in the business, with a WALT of 41.2 years when including tenant renewal options.
VICI has high tenant concentration with only 13 tenants, but its operators are well capitalized and cannot fully operate without the real estate VICI owns. VICI’s properties are so iconic that operators would go through great lengths to maintain their leases.
The company’s largest tenant is Caesars Entertainment (CZR) which leases 18 properties and makes up 39% of VICI annual rent. MGM Resorts comes in second with 13 properties that make up 35% of VICI’s annual rent.
VICI is investment grade rated with a credit rating of BBB- from S&P Global. The company has solid debt metrics including a net leverage ratio of 5.4x, a long-term debt to capital ratio of 40.60%, and an EBITDA to interest expense ratio of 4.25x.
99% of the company’s debt is fixed rate and it debt maturities are well-staggered with a weighted average term to maturity of 6.6 years.
Since 2019 the company has had an average AFFO growth rate of 6.74% and an average dividend growth rate of 10.11%. Analysts expect steady growth over the coming years, with AFFO per share expected to increase by 3% in 2025 and by 4% the following year.
VICI pays a 4.94% dividend yield and trades at a P/AFFO of 15.11x, compared to its average AFFO multiple of 15.93x.
We rate VICI Properties a Buy.
FAST Graphs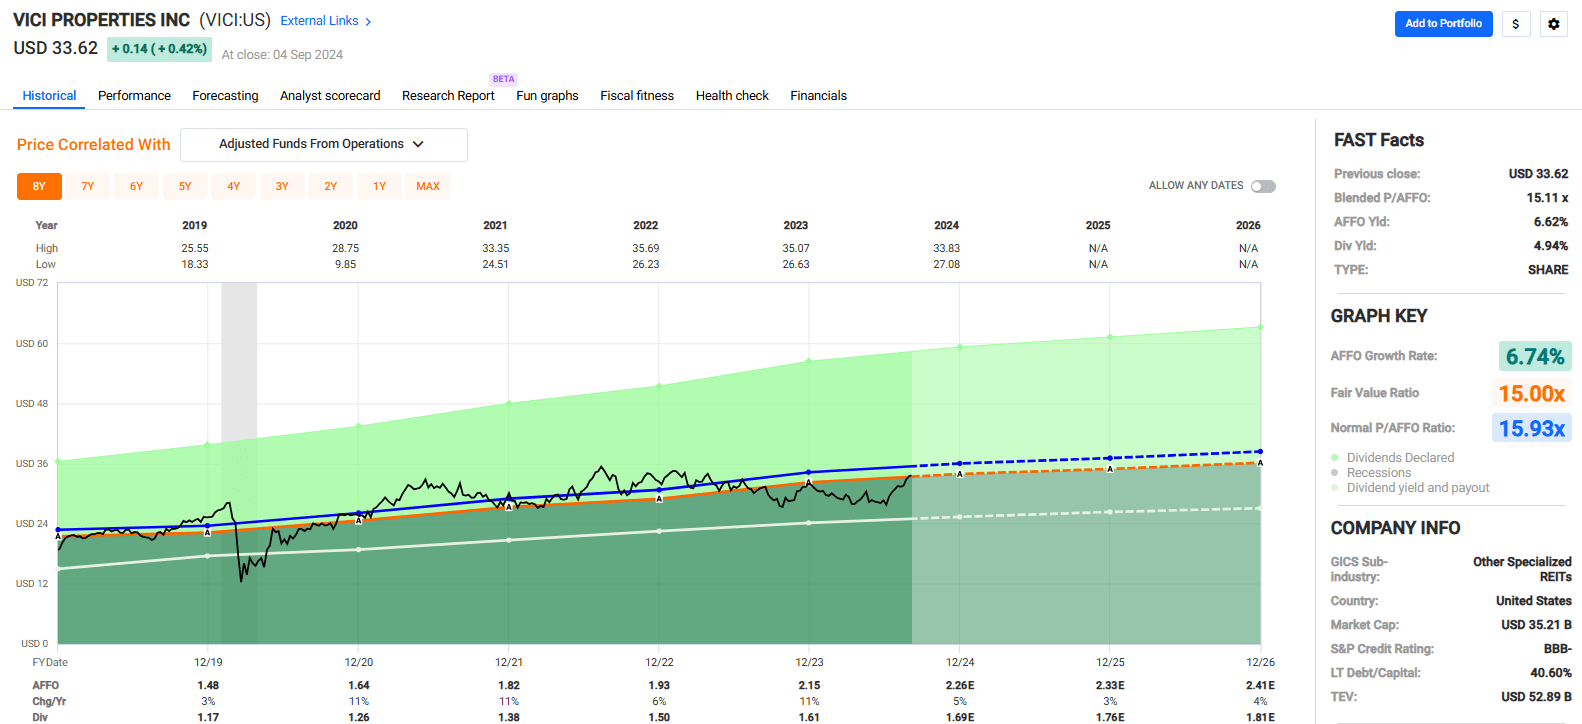
In Closing
I hope you enjoyed my “Black Swan” article today…
It would be great if you can let me know what you think the next “Black Swan” event might be…
In the words of the legendary investor Howard Marks,
