


NVIDIA stock running out of steam in the near term Paul Bradbury/OJO Images via Getty Images
Performance Assessment
My Q2 FY25 preview note on Nvidia Corporation (NASDAQ:NVDA) communicated a change in stance from my earlier bullish view to a more cautious “Neutral/Hold.” After earnings, Nvidia closed at $116.95; 7.9% lower than the $126.46 level where it was when I published the quarterly preview on August 26, 2024. In the same period, the S&P 500 (SP500) fell 0.44%. Since my last article, performance has added +7.4% of value.
Thesis
As anticipated, Nvidia’s Q2 FY25 revenue guidance didn’t impress the market. I am changing my stance to a “Sell” after noting the following:
- High growth seems priced in
- Margin expansion may take a pause
- Valuations aren’t much cheaper
- Relative technicals indicate signs of bullish trend exhaustion
- Strong Blackwell orders are an upside risk.
High growth seems priced in
Revenues (USD mn) (Company Filings, Author’s Analysis)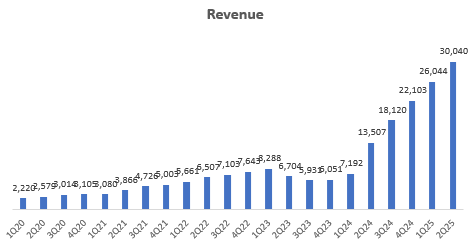
Nvidia’s Q2 FY25 printed $30 billion in revenues (122.4% YoY, 15.3% QoQ). Consistent with its track record, it also beat consensus estimates by 4.5%:
Revenue Surprise vs Consensus (Capital IQ, Author’s Analysis)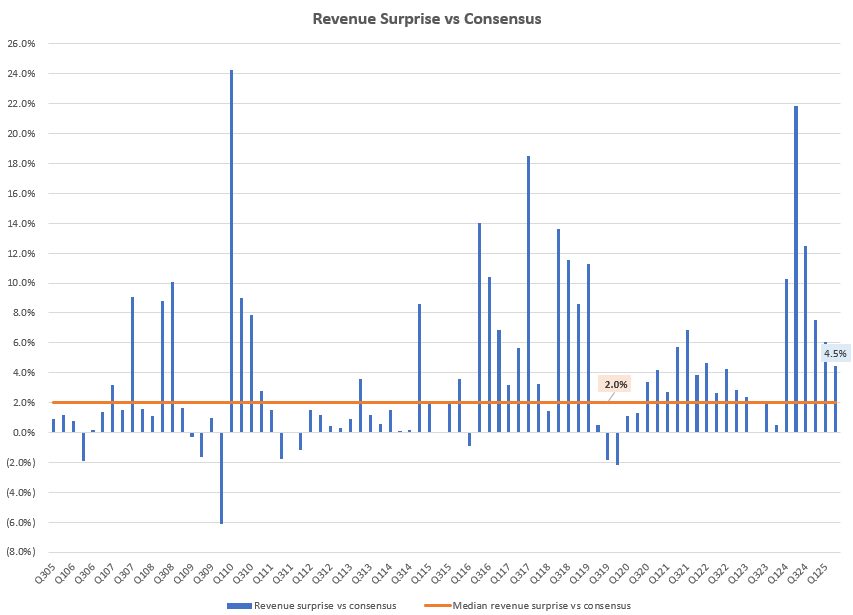
However, the Street’s whisper number for revenue going into the earnings release was $30 billion. So from this perspective, Nvidia’s revenue result merely matched expectations.
Consensus numbers are what sell-side (analysts, not investors, putting money in the stock) estimates indicate. Whisper numbers represent the unofficial word-on-the-street estimates of what the buy-side (the actual investors with monetary stake behind their views) is expecting.
On the revenue guidance side, as I had feared, it was nothing stellar; the midpoint level of $32.5 billion for Q3 FY25 was higher than consensus by 2.5%. Some are viewing this as in-line guidance:
Revenue Guidance Surprise vs Consensus (Capital IQ, Author’s Analysis)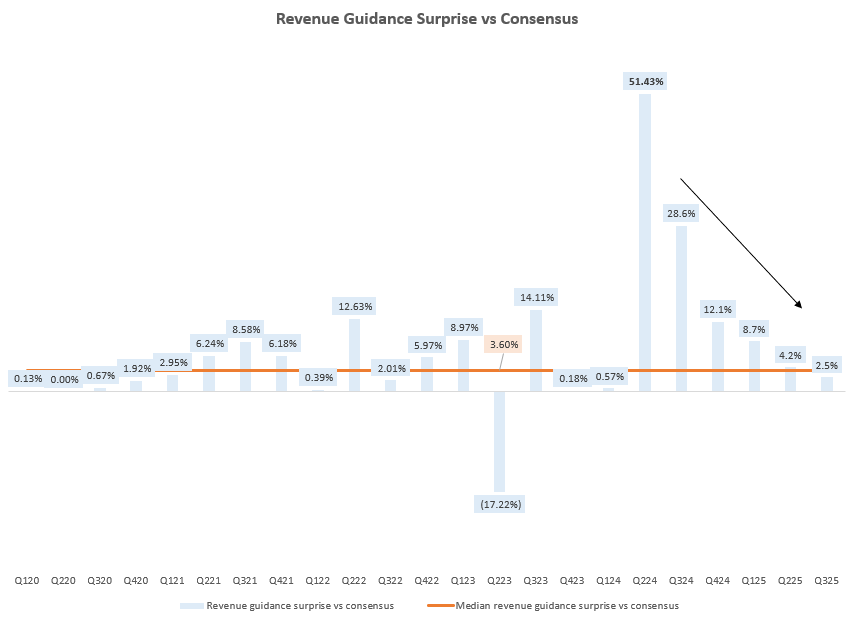
Unsurprisingly, given the 8% selloff in Micron (MU) under similar circumstances, Nvidia also fell almost 7% in after hours trading yesterday. Note that Micron’s drop continued as it is down ~30% since its last result beat but was in-line guidance earnings.
Overall, I believe this means Nvidia’s growth, although high, is being fully priced in the market. I suspect some stock weakness will continue to follow suit, as investors rotate into other opportunities, such as the financials sector.
Margin expansion may take a pause
Nvidia’s extent of EBIT margin surprise vs. consensus was also smaller than expected at 65bps vs. the median 142bps:
EBIT Margin Surprise vs Consensus (bps) (Capital IQ, Author’s Analysis)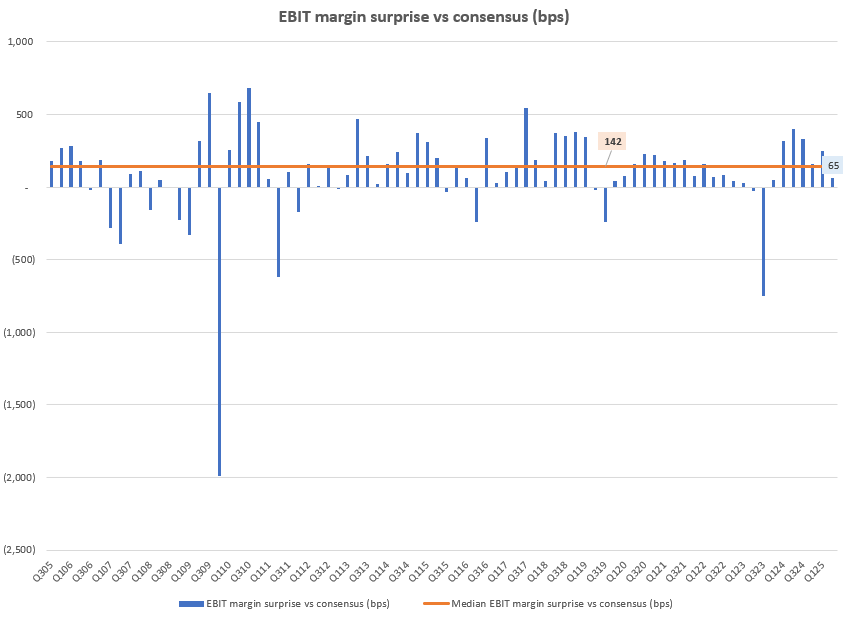
This was driven mostly by a 330bps QoQ fall in gross profit margins:
Gross Profit Margin (Company Filings, Author’s Analysis)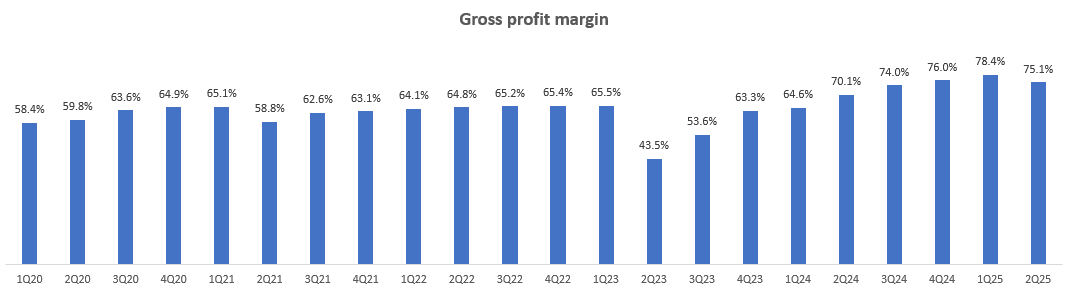
Management attributed this to a mix-shift effect and, more importantly, higher inventory costs for Blackwell – Nvidia’s latest GPU architecture that would allow enterprises to run real-time generative AI at 25x lower cost:
GAAP gross margins were 75.1% and non-GAAP gross margins were 75.7%, down sequentially due to a higher mix of new products within data center and inventory provisions for low-yielding Blackwell material.
– CFO Colette Kress in the Q2 FY25 earnings call.
Going forward, it looks like the higher costs associated with Blackwell inventories would lead to gross margin stabilization around 74-75%:
GAAP and non-GAAP gross margins are expected to be 74.4% and 75.0%, respectively, plus or minus 50 basis points. For the full year, gross margins are expected to be in the mid-70% range.
– CFO Colette Kress in the Q2 FY25 earnings call.
This means the margin expansion that was a core part of my bullish thesis earlier may be taking a pause – a slightly negative development vs. my thesis expectations.
Valuations aren’t much cheaper
NVDA 1-yr fwd P/E and MCAP (USD bn) (Capital IQ, Author’s Analysis)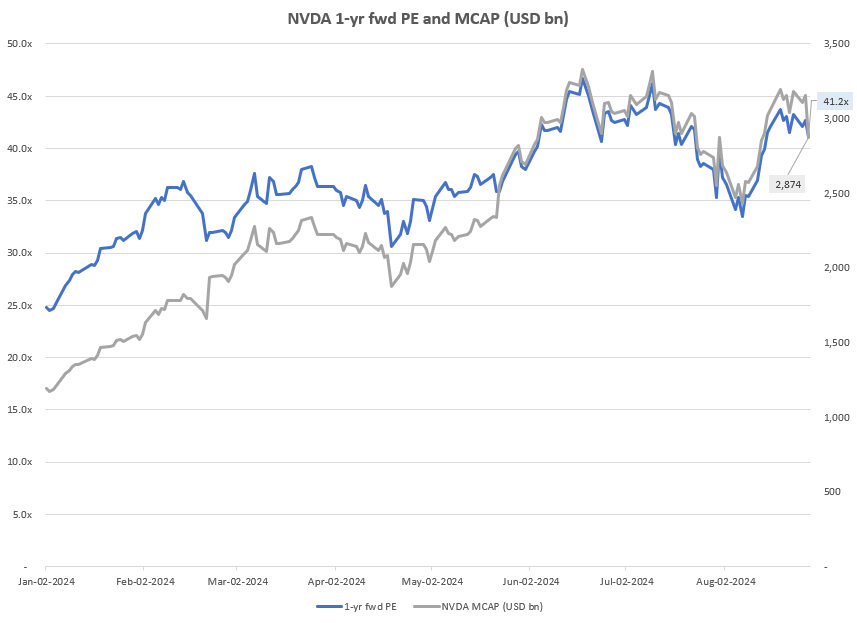
Given the information on consensus estimates so far, Nvidia’s 1-yr fwd P/E of 41.2x has not changed much despite a 7% after-hours fall in the stock price and market cap. A few days before the earnings release, 1-yr fwd P/Es were 43.2x. Hence, I don’t think the valuations have gotten much cheaper to make buys attractive.
Technicals indicate signs of bullish trend exhaustion
If this is your first time reading a Hunting Alpha article using Technical Analysis, you may want to read this post, which explains how and why I read the charts the way I do. All my charts reflect total shareholder return as they are adjusted for dividends/distributions.
Relative Read of NVDA vs SPX500
NVDA vs SPX500 Technical Analysis (TradingView, Author’s Analysis)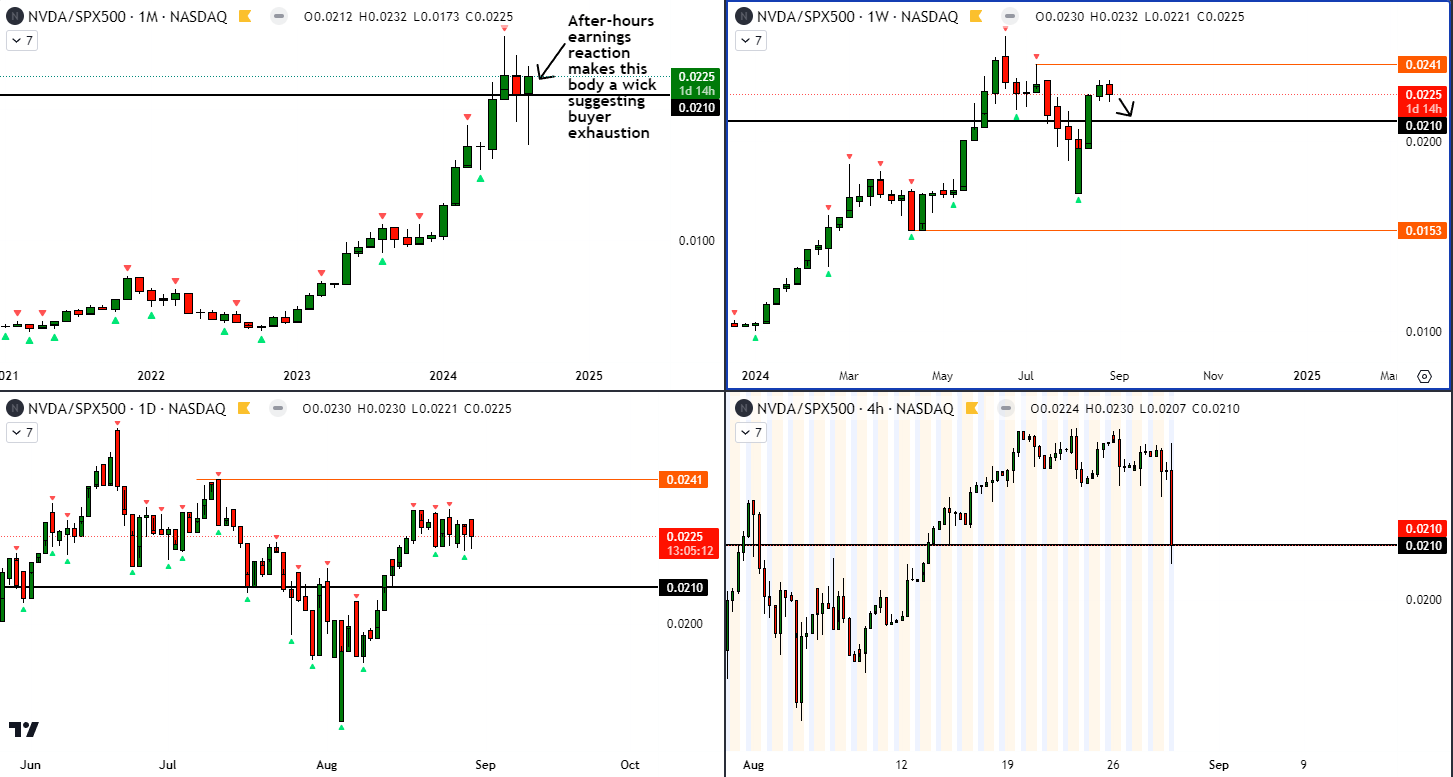
On the relative chart of NVDA vs. the S&P 500 (SPX, SPY), the after-hours movement is only visible on the intraday 4-hour charts. I have marked the after-hours close level with a horizontal black line to more clearly see how the higher timeframe weekly and monthly picture looks like. What stands out to me is that after accounting for the after-hours close, the monthly chart shows a wick rejection of August 2024’s candle body, printing a doji. I interpret this to be a sign of buyer exhaustion and an increased risk of downside ahead, corresponding to a period of underperformance vs. the S&P 500.
Strong Blackwell orders are an upside risk
In Note 12 – Commitments and Contingencies, Purchase Obligations section of the 10Q and 10Ks, Nvidia discloses the amount of future inventory and capacity purchase obligations. This figure spiked 47.9% QoQ from $18.8 billion to $27.8 billion in Q2 FY25:
Inventory and Long-Term Supply and Capacity Obligations (USD mn) (Company Filings, Author’s Analysis)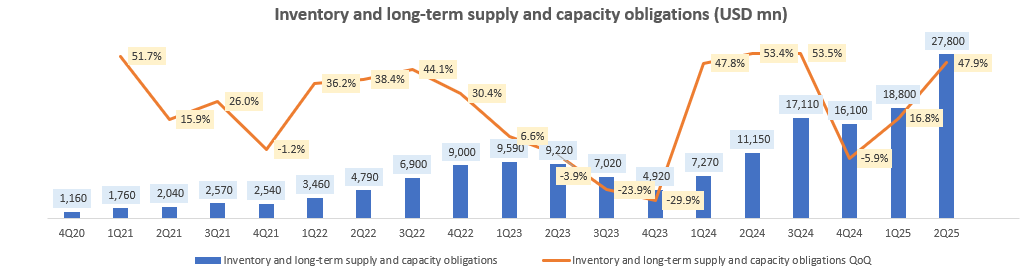
This was driven by “commitments for Hopper and Blackwell capacity and components.” Management’s commentary also points toward bullish growth expectations 2 quarters out from now:
Blackwell production ramp is scheduled to begin in the fourth quarter and continue into fiscal year ’26. In Q4, we expect to ship several billion dollars in Blackwell revenue. Hopper shipments are expected to increase in the second half of fiscal 2025… Demand for Blackwell platforms is well above supply, and we expect this to continue into next year.
– CFO Colette Kress in the Q2 FY25 earnings call.
Overall, I view this as a source of medium-longer term upside risk, since this indicates a buoyant order growth for Nvidia’s products. Whilst growth for the rest of CY 2024 may be priced in, I recognize that Nvidia may surprise on growth in CY 2025 when Blackwell shipments are in full-force.
Takeaway & Positioning
I had a cautious outlook going into Nvidia’s Q2 FY25 earnings, as I thought the market may react negatively to an unimpressive revenue guide vs. consensus. This tactical idea has played out as expected since NVIDIA stock is down almost 8% since publication of my preview note wherein I had changed my stance from a ‘Buy’ to a “Neutral/Hold.”
The in-line revenue guidance for Q3 FY25 and in-line revenues relative to the Street’s whisper figure of $30 billion for Q2 FY25 suggests that Nvidia’s growth, although high, is being priced in at least for the next quarter or two. Moreover, my earlier thesis of margin expansion seems to be on-hold as gross margins came in 330bps sequentially lower and management’s outlook indicates stabilization rather than a continued increase for the rest of the financial year.
Despite a lower after-hours stock price, valuations also aren’t that much cheaper, making buys less attractive. And NVDA stock’s relative technicals vs. the S&P 500 paint signs of bullish exhaustion on the monthly chart, which I believe warns of downside (underperformance) potential ahead.
Given these considerations, I am downgrading NVIDIA to a tactical “Sell.” The key risk to my thesis is the resumption of growth surprises in 2025 and beyond as Blackwell rolls out in Q4 FY24 (which ends in January 2025).
How to interpret Hunting Alpha’s ratings:
Strong Buy: Expect the company to outperform the S&P 500 on a total shareholder return basis, with higher than usual confidence. I also have a net long position in the security in my personal portfolio.
Buy: Expect the company to outperform the S&P 500 on a total shareholder return basis
Neutral/hold: Expect the company to perform in-line with the S&P 500 on a total shareholder return basis
Sell: Expect the company to underperform the S&P 500 on a total shareholder return basis
Strong Sell: Expect the company to underperform the S&P 500 on a total shareholder return basis, with higher than usual confidence
The typical time-horizon for my views is multiple quarters to around a year. It is not set in stone. However, I will share updates on my changes in stance in a pinned comment to this article and may also publish a new article discussing the reasons for the change in view.
