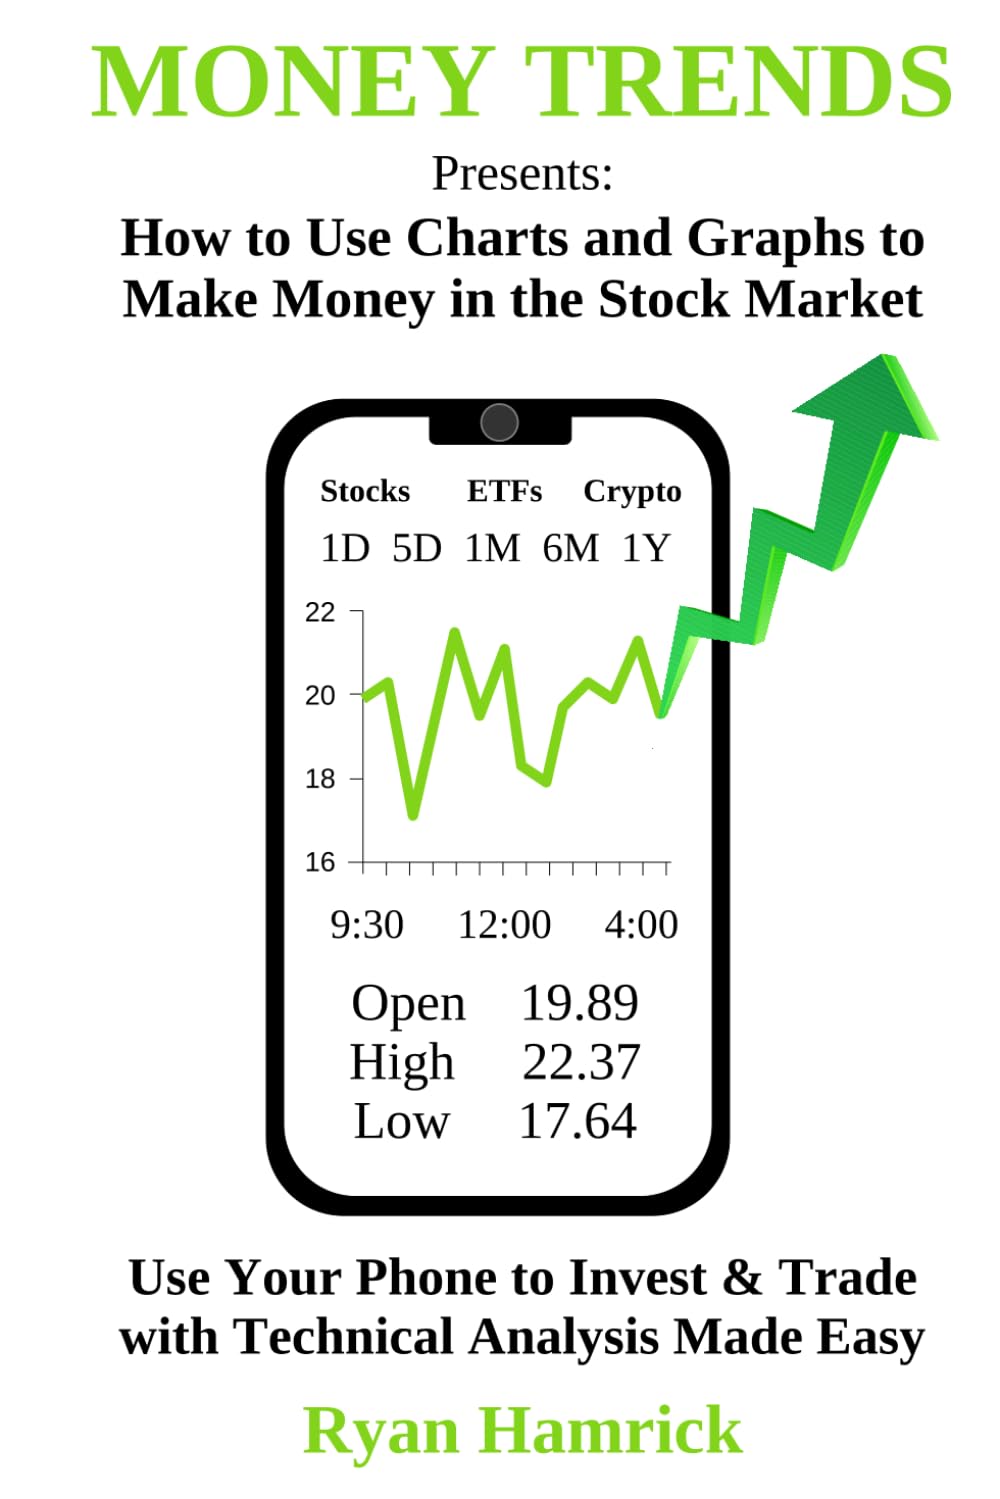
Price: $17.99
(as of Feb 21, 2025 22:28:31 UTC – Details)

Who has the time to be stuck behind a computer all day?
MONEY TRENDS developed this book so you can grab your phone, spot patterns ready for success, and make a trade.
Technical analysis is the study of graphs in an attempt to predict the next move. While there are many books on technical analysis in circulation, they do not cover the main factor tied directly to charts and graphs – Human Behavior.
MONEY TRENDS combines technical analysis with human behavior so you can learn why prices move. This combination helps predict the next move of traders, thus the next move in price. When you can predict the next move in price, you can make a fortune in the stock market.
It is critical to understand the language of money, and graphs help you do exactly that. Once you begin to learn the language of money, you will be able to hear and understand what money is saying to you!
Highlights in this MONEY TRENDS edition:
How to Interpret Charts and Graphs
Up Trends and Down Trends
Strategies for Chart Patterns
Critical Buy and Sell Points
Behavioral Analysis for Market Insight
If you can understand the behavior of other traders, you will have the upper hand in predicting what they will do next. Information is power. Use the information in this book and Reach Success Today!
Learn the language of money.
Read this book and begin listening to what money is saying to you!
ASIN : B0DNCRZ91G
Publisher : Independently published (November 16, 2024)
Language : English
Paperback : 174 pages
ISBN-13 : 979-8345855072
Item Weight : 11.4 ounces
Dimensions : 6 x 0.4 x 9 inches


