


Price: $39.99
(as of Oct 15, 2024 01:39:30 UTC – Details)

Product Description

Learn and Understand Trading More Effectively with Chart Pattern Flash Cards from Wall Street Merch
Taking on the stock market has finally become a mainstream process that doesn’t require a specific education or money threshold. It’s easier than ever for the “common” man or woman to learn about the stock market and create portfolios. We developed Wall Street Merch Stock Market Flash Cards to help you learn more about the market, including Bull and Bear trends, so you can be better prepared to make smarter bids. These easy-to-follow cards can teach you how to read trends, analyze data, and better understand fluctuations, all of which can translate to real trading goals and opportunities.
Examining Patterns
Most stock market success begins with learning how patterns work within the stock market, and our flashcards can give you a more visual approach to chart patterns in both Bullish and Bearish territories.
Easy-to-Read Data
Our cards feature exact data with easy-to-understand charts that provide a more consistent approach to stock education, which makes them an ideal beginner’s guide.
Product Details:
Stock Market Flash Cards101 Chart Pattern TrendsBased on Real Trade DataLearn Bull and Bear MarketsStudy and Learn On the GoSmart Choice for Beginners

Real Statistics, Real Data, Real Learning
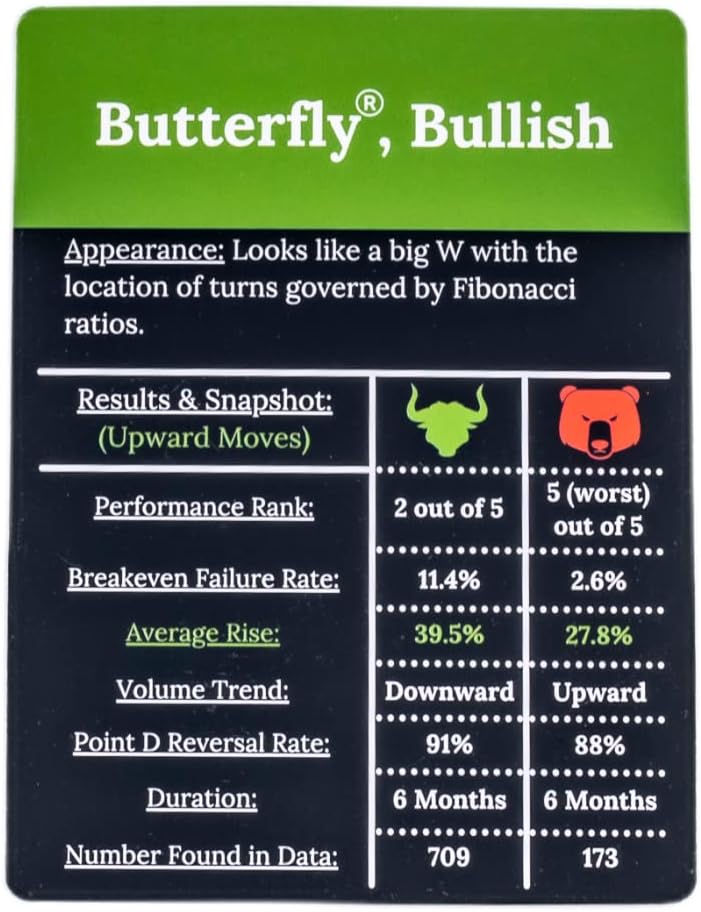
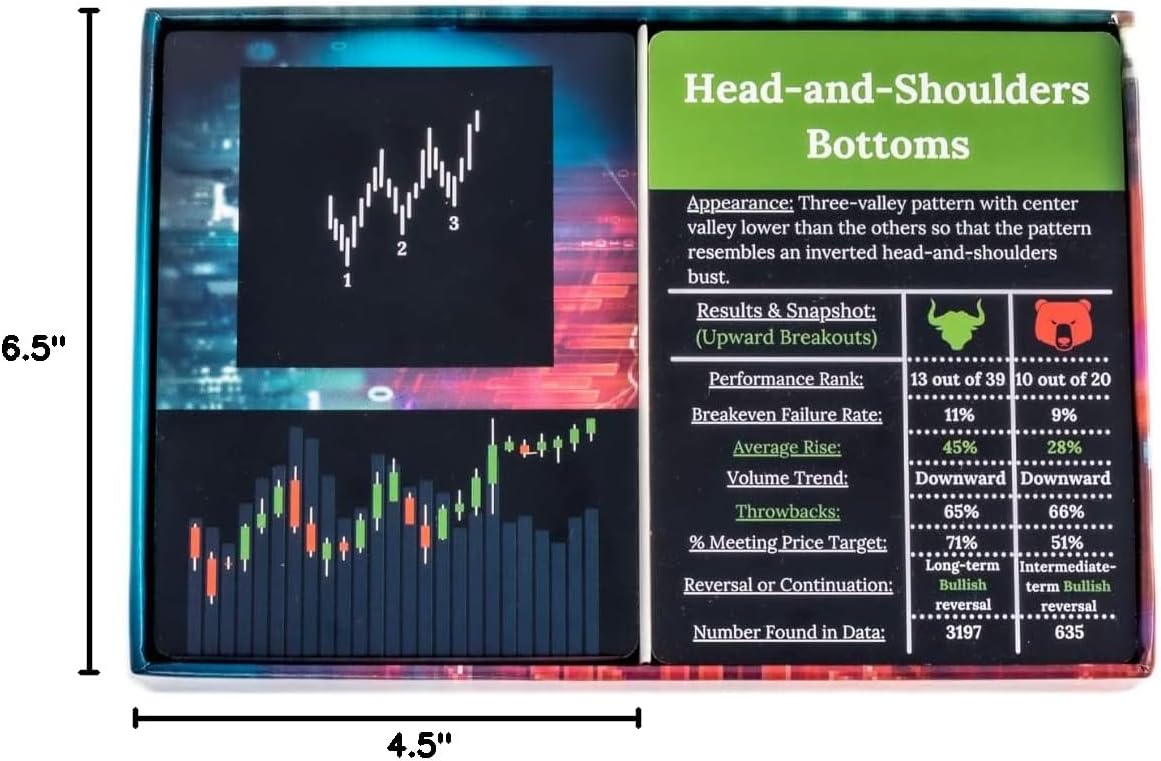
When learning about the stock market, using fake data with no real reference point wouldn’t give you the kind of support you’d need, especially starting out. Our cards boast important statistics, including performance rank, break-even failure rates, and average increase/decline. All are based on Thomas Bulkowski’s data from 1,396 stocks (1991-2020).

Educational Application
These flashcards are meant to give you a broader view of how the stock market works based on visual data. They are not intended to tell you how and where to invest your money. Please use them as a way to better understand market changes, investment histories, and comprehensive technical data.
Technical Analysis Built on a Solid Foundation


Improve Recognition
Understanding graphs and statistical data is essential; doing it faster is even more critical. These cards can help you hone your stock-building eye.
Bull and Bear Stock Markets
The stock market can fluctuate dramatically based on trends, especially world trends, and these cards help you understand how that impacts personal stock market efforts.
Memorize Rise and Decline
Patterns play a significant role in our trading and investment choices, so knowing how stocks might rise or fall can impact the real-world trades you make daily.
Add to Cart
Add to Cart
Add to Cart
Customer Reviews
4.3 out of 5 stars
143
4.2 out of 5 stars
65
4.5 out of 5 stars
37
Price
$39.99$39.99 $39.99$39.99 $39.99$39.99
Number of Cards
103 101 110
What you will learn?
How to read and properly identify candlestick patterns, reversal/continuation rates, performance rank, and frequency rank. How to properly identify chart patterns, upward/downward breakouts, performance ranking, breakeven failure rates, average rise/decline rates. How to read financial statements and interpret a company’s income statement, balance sheet, and statement of cash flows. This includes financial performance ratios and metrics.
Real Historical Data:
✓
✓
Beginner Friendly?
✓
✓
✓
Bull and Bear Market Data:
✓
✓
Flashcard format:
✓
✓
✓
Who is this for?
Stock Market Traders Stock Market Traders Stock Market Investors
Great Gift?
✓
✓
✓
Educational Stock Market Flash Cards – A great tool to learn about stock market trading these candlestick flash cards help you understand bull and bear stock market trends, stock patterns, and other vital statistical data used in technical analysis.
Real Chart Patterns and Investment Data – These candlestick patterns flash cards were created using real references to the textbook “Encyclopedia of Chart Patterns” to ensure consistent technical analysis based on real historical data.
Gain a Deep Understanding of Trading – Like a beginner guide to stock market trading our candlestick flash cards help you create a stronger base of knowledge which translates to smarter and more educated trades.
Study When and Where You Want – Great stock market gifts for anyone looking to learn more about standard or Forex trading these cards are easy to understand and easy to take with you anywhere you go, so you can practice and learn every day.
Accurate and Engaging Visuals – We use bright, vibrant colors and accurate trading charts to help ensure you know what you’re looking at on the card matches the potential chart you’d see on any standard trading website.
